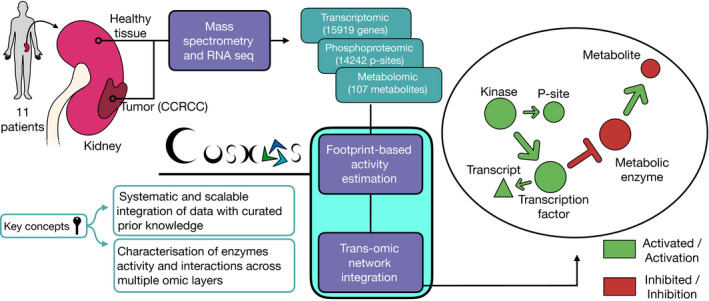
Figure 1. Overview of analysis pipeline.

From left to right: We sampled and processed 11 patient tumors and healthy kidney tissues from the same kidney through RNA‐sequencing and 9 of those same patients through mass spectrometry to characterize their transcriptomics, phosphoproteomics, and metabolomics profiles. We calculated differential abundance for each detected gene, phosphopeptide, and metabolite. We estimated kinase and transcription factor activities using the differential analysis statistics and footprint‐based methods. We used the estimated activities alongside the differential metabolite abundances to contextualize (i.e., extract the subnetwork that better explains the phenotype of interest) a generic trans‐omics causal prior knowledge network (meta PKN).
