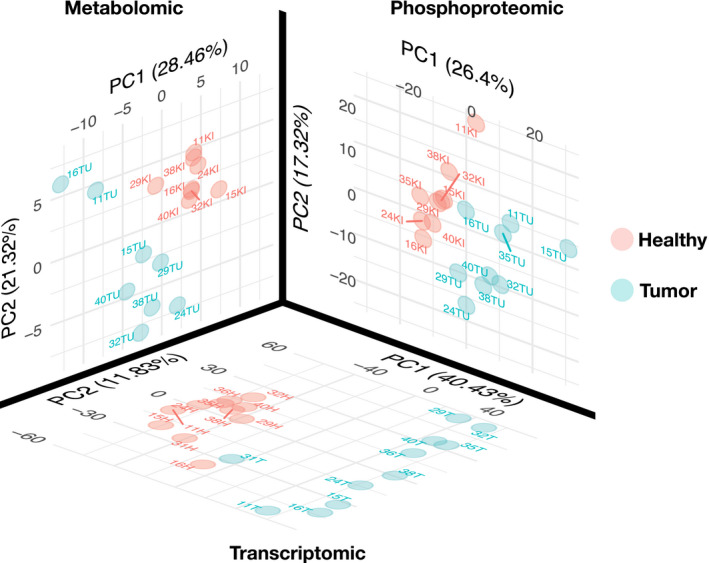
Figure EV1. First two components of PCA of omic datasets of kidney tumor and healthy samples.

PCA of metabolomics (107 metabolites), phosphoproteomics (14,243 phosphosites) and transcriptomics (15,919 transcripts) datasets for tumor and healthy tissues samples. For each omics dataset, PCA is run independently on normalised datasets and the first two components are plotted. Each omics shows a clear separation between tumor and healthy tissue.
