
Figure EV2. Differential analysis of kidney tumor and healthy sample.
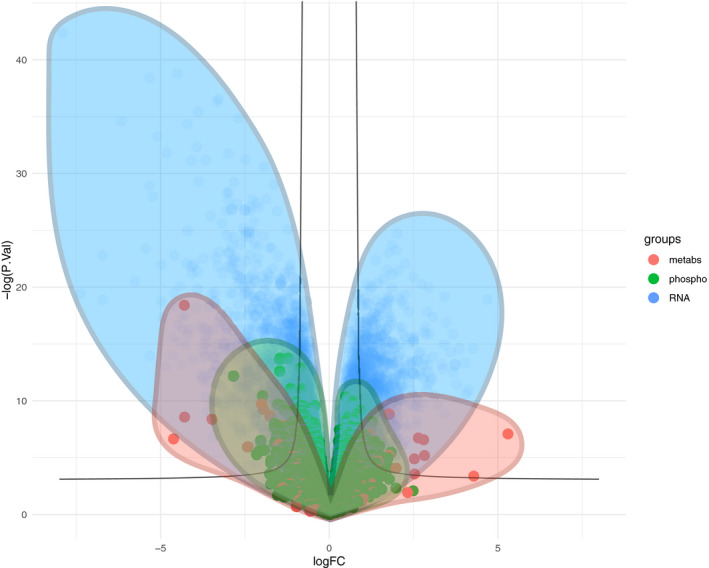
Combined volcano plot of metabolomics (107 metabolites), phosphoproteomics (14,243 phosphosites) and transcriptomics (15,919 transcripts), displaying the surface occupied by the points of each type of omic data. X axis represent the log2 fold change between healthy and tumour. Y axis represents the −log10 P‐value of a unpaired moderated t‐statistic obtained from using LIMMA.