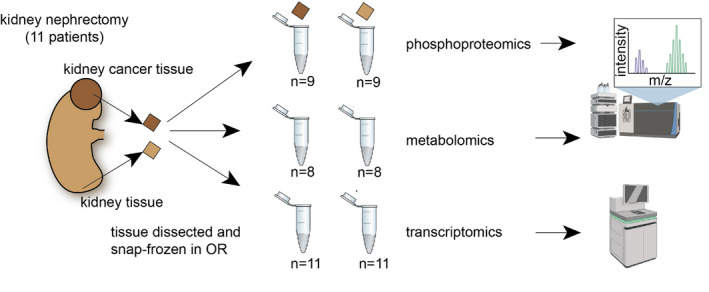
Figure EV4. Overview of sample collection and study design.

Schematic of the process sample collection and multi‐omics data generation. We included a total of 22 samples from 11 renal cancer patients (6 men, age 65.0 ± 14.31, 5 women, age 65.2 ± 9.257(mean ± SD)) for transcriptomics. Phosphoproteomics was also measured in a subset of 18 samples from 9 of these patients (6 men, age 65 ± 14.31; 3 women, age 63.33 ± 11.06(mean ± SD)), and metabolomics was also measured in 16 samples from 8 out of these 9 patient (5 men, age 62 ± 13.23; 3 women, age 63.33 ± 9.89(mean ± SD), Dataset EV1. Patients underwent nephrectomy due to renal cancer. We processed tissue from within the cancer and a distant unaffected area of the same kidney. The tissue was snap‐frozen immediately after nephrectomy within the operation room. Figure parts created with BioRender.com.
