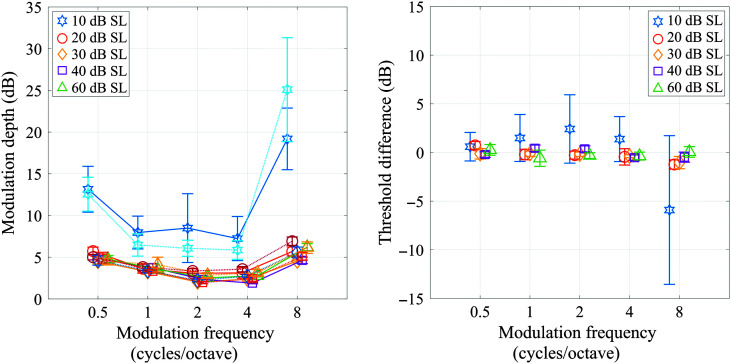
Figure 4.
The effect of sensation level as a function of carrier bandwidth. Panel A displays a comparison of spectral modulation transfer functions (SMTFs) for two bandwidth conditions as a function of sensation level. The solid lines represent the results for a 6-octave carrier bandwidth (200–12800 Hz), and the dashed lines represent the results for a 3-octave carrier bandwidth (400–3200 Hz). Panel B shows the difference between the spectral modulation detection thresholds obtained with each of two bandwidth conditions (with standard error).

