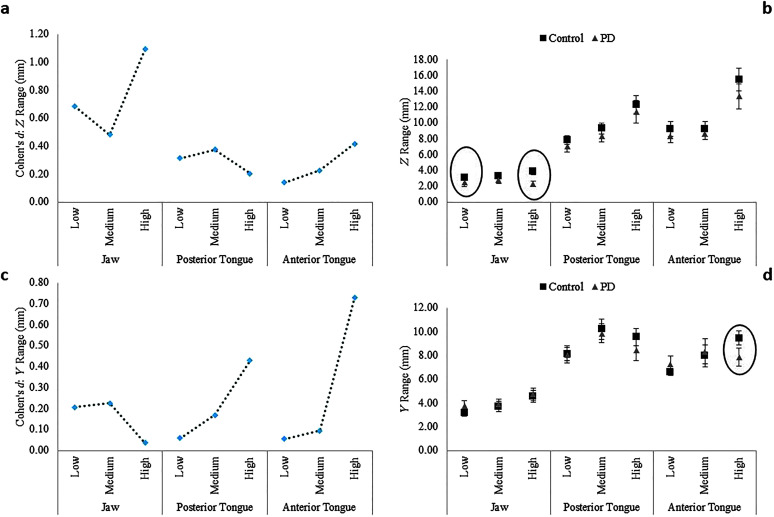
Figure 3.
Between-groups effect sizes (Cohen's d) by articulator and complexity level for z range (anterior–posterior; a) and y range (ventral–dorsal; c). Mean (standard error) of z range (b) and y range (d) for each participant group, articulator, and complexity level. Statistically significant between-groups differences indicated by circles on the right. PD = Parkinson's disease.

