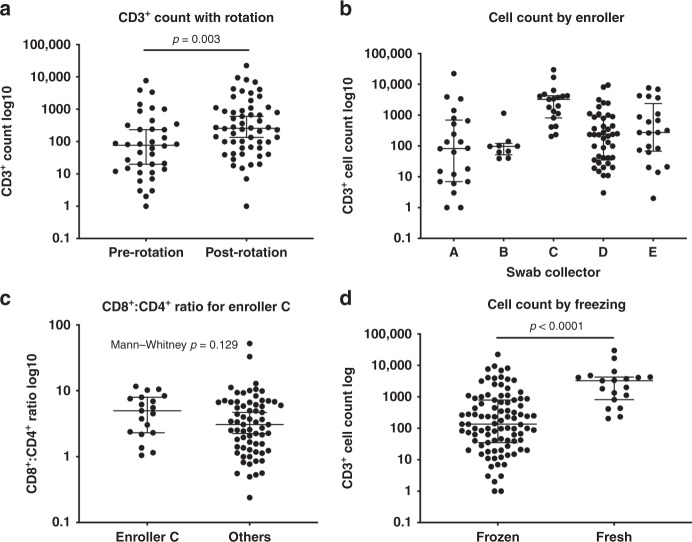
Fig. 2. Identification of Live CD3+ T cells on nasal swabs.
a Total CD3+ count per swab: Mann–Whitney test showing difference before and after swab rotation, p = 0.003. b Total CD3+ lymphocyte count obtained by enrolling provider or assistant. Kruskal–Wallis quality of populations rank test, p < 0.001. c CD8+:CD4+ ratio by enroller: CD3+ count per swab obtained by enroller. d Cell count per swab showing fewer cells with freezing protocol, Mann–Whitney test, p < 0.001.

