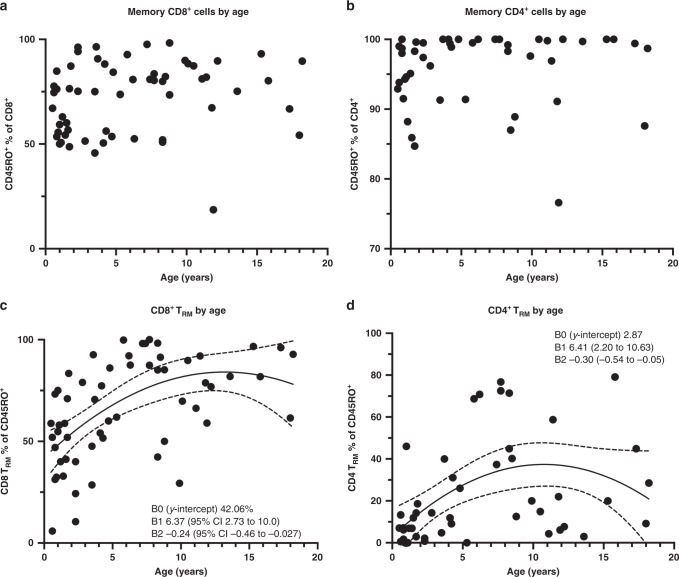
Fig. 7. Analysis of total memory and resident memory T cells as a function of age.
a Percentage of total CD8+ cells that are CD45RO+. No correlation with age is noted. b Percentage of total CD4+ cells that are CD45RO+. No correlation with age is noted. c Percentage of CD103+CD69+ cells (TRM) of CD45RO+ CD8+ cells; B1 is positive indicating a positive correlation that then curves downward (B2). Confidence intervals indicate that both trends are significant. B0 is the y-intercept. d Percentage of CD103+CD69+ cells (TRM) of CD45RO+ CD4+ cells; B1 is positive indicating a positive correlation that then curves downward (B2). Confidence intervals indicate that both trends are significant.

