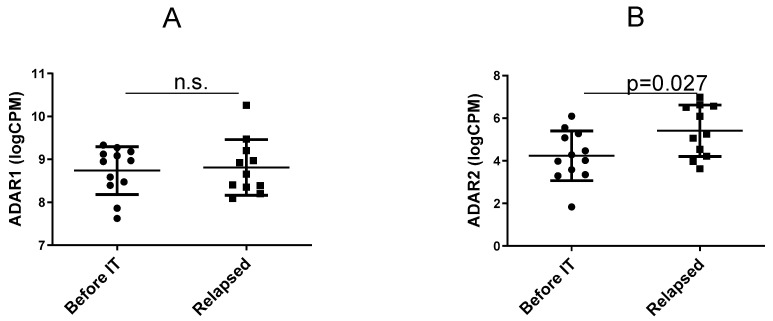
Figure 1.
Adenosine deaminase acting on RNA (ADAR) gene expression. The graphs show for each cell line the gene expression of ADAR1 (in A) and ADAR2 (in B) in the two groups: before immunotherapy (“Before IT”) and in relapse during immunotherapy (“Relapsed”). The p value calculated from the unpaired t-test is indicated (“n.s.” stands for non-significant).

