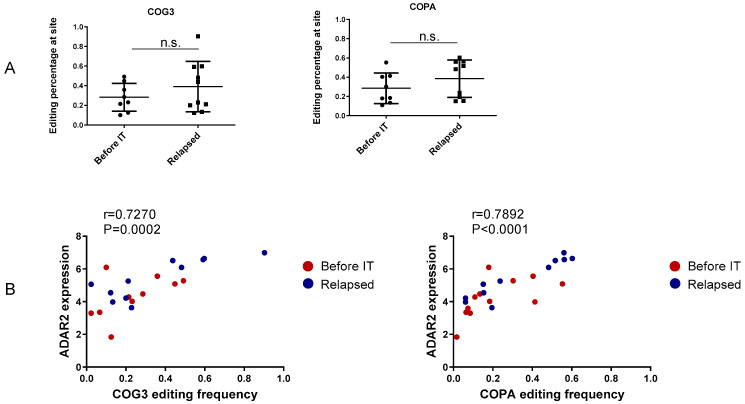
Figure 2.
Frequency of recoding editing in component of oligomeric Golgi complex 3 (COG3) and coatomer protein complex subunit α (COPA). The graphs shown in (A) report the percentage of recoding editing observed in COG3 (position 46090371) and COPA (position 160302244) for the two groups: before immunotherapy (“Before IT”) and relapse during immunotherapy (“Relapsed”). The correlation plots given in (B) depict the level of ADAR2 expression relative to the editing frequencies of COG3 and COPA. Correlation coefficient “r” and Pearson correlation value “p” value are indicated. Each dot shown in the figures corresponds to one cell line. n.s.—not significant.

