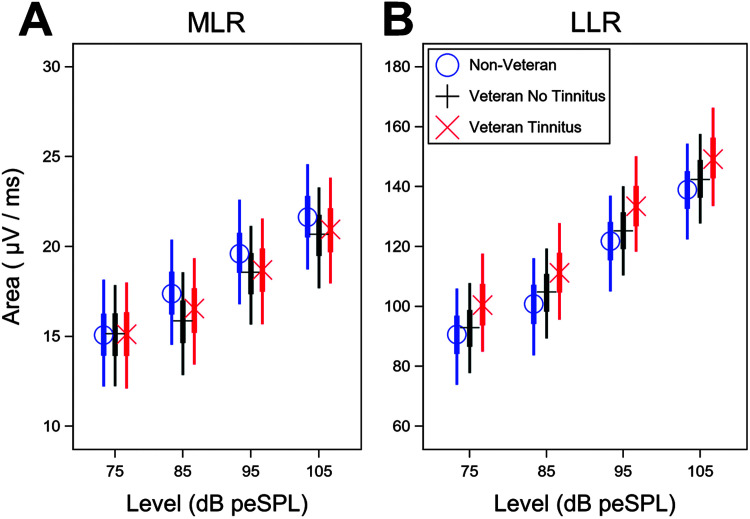
Figure 4.
Model-based middle latency response (MLR) and late latency response (LLR) areas by study group show same trends after adjusting for sex and average distortion product otoacoustic emission (DPOAE) level. After statistical adjustment for sex and average DPOAE level from 3 to 8 kHz, the Veteran groups continue to show a reduction in the MLR area, but not in the LLR area, compared to the non-Veteran control group. (A) Model-based mean MLR and (B) LLR areas by stimulus level are indicated by symbol and color for each study group. MLR and LLR mean areas are plotted given male sex and an average DPOAE level from 3 to 8 kHz equal to the sample mean. Thin lines show the 90% Bayesian confidence interval, and thick lines represent the interquartile range.

