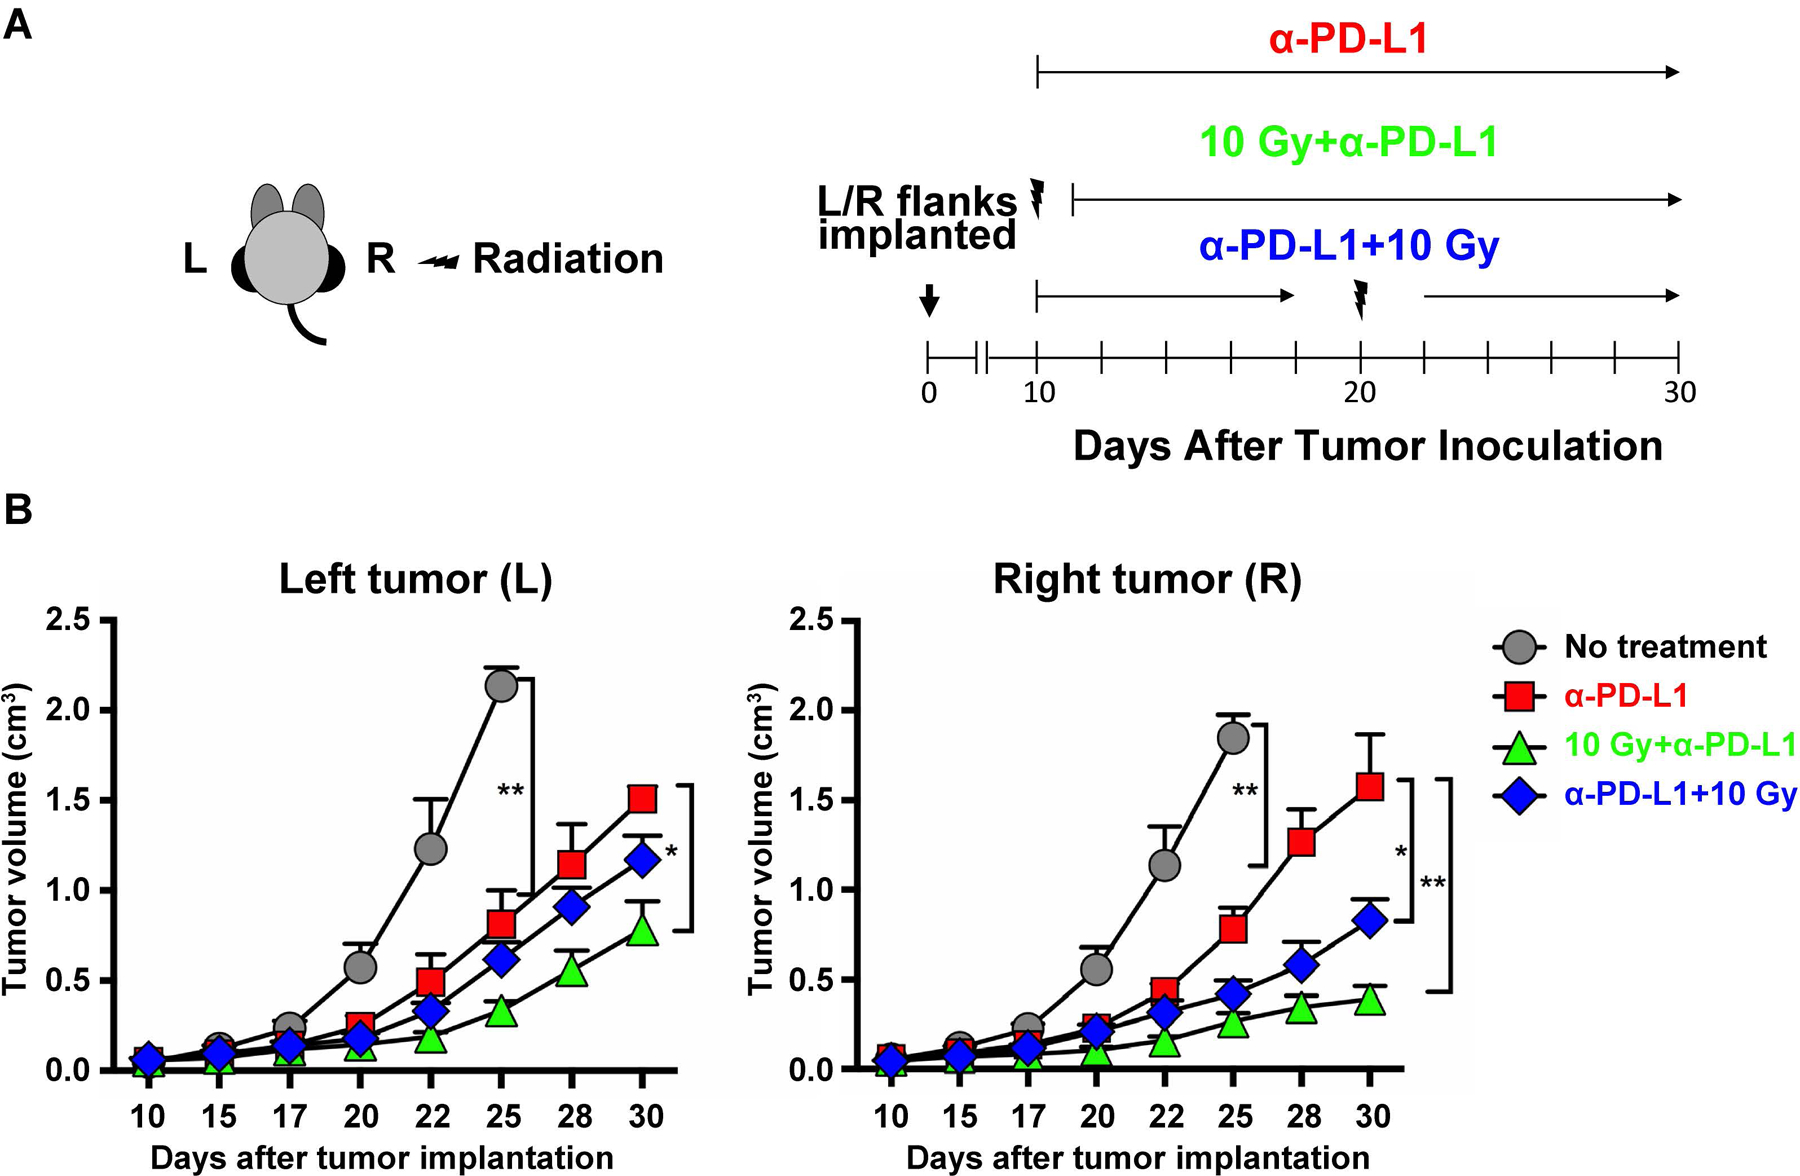
Figure 3.

Radiation and α-PD-L1 response in vivo. a Mice implanted in left (L) and right (R) flanks with B16F10-GP cells received: (i) no treatment; (ii) α-PD-L1 alone; (iii) 10 Gy (right flank) on Day 10 (morning) before α-PD-L1 (RT→ICI) (evening); (iv) α-PD-L1 first, followed by 10 Gy (right flank) on Day 20 (ICI→RT). Sequence of α-PD-L1 and radiation is shown (n=5). α-PD-L1 antibody (200 μg; clone 29F.1A12) was in phosphate buffer saline (500 μL). b Mean tumor volumes of right and left tumors after different treatments (*p<0.05, **p<0.01). Tumor measurements were taken with at least 5 mice per group (*p<0.05; **p<0.01). Using ANOVA followed by Turkey, the two treatment groups have a p-value of 0.05 for the right side, while the left side they are not significantly different. Difference between the two treatment groups by T-test, the two groups are significantly different from one another on the right side (p<0.001), while left side p-value is 0.055.
