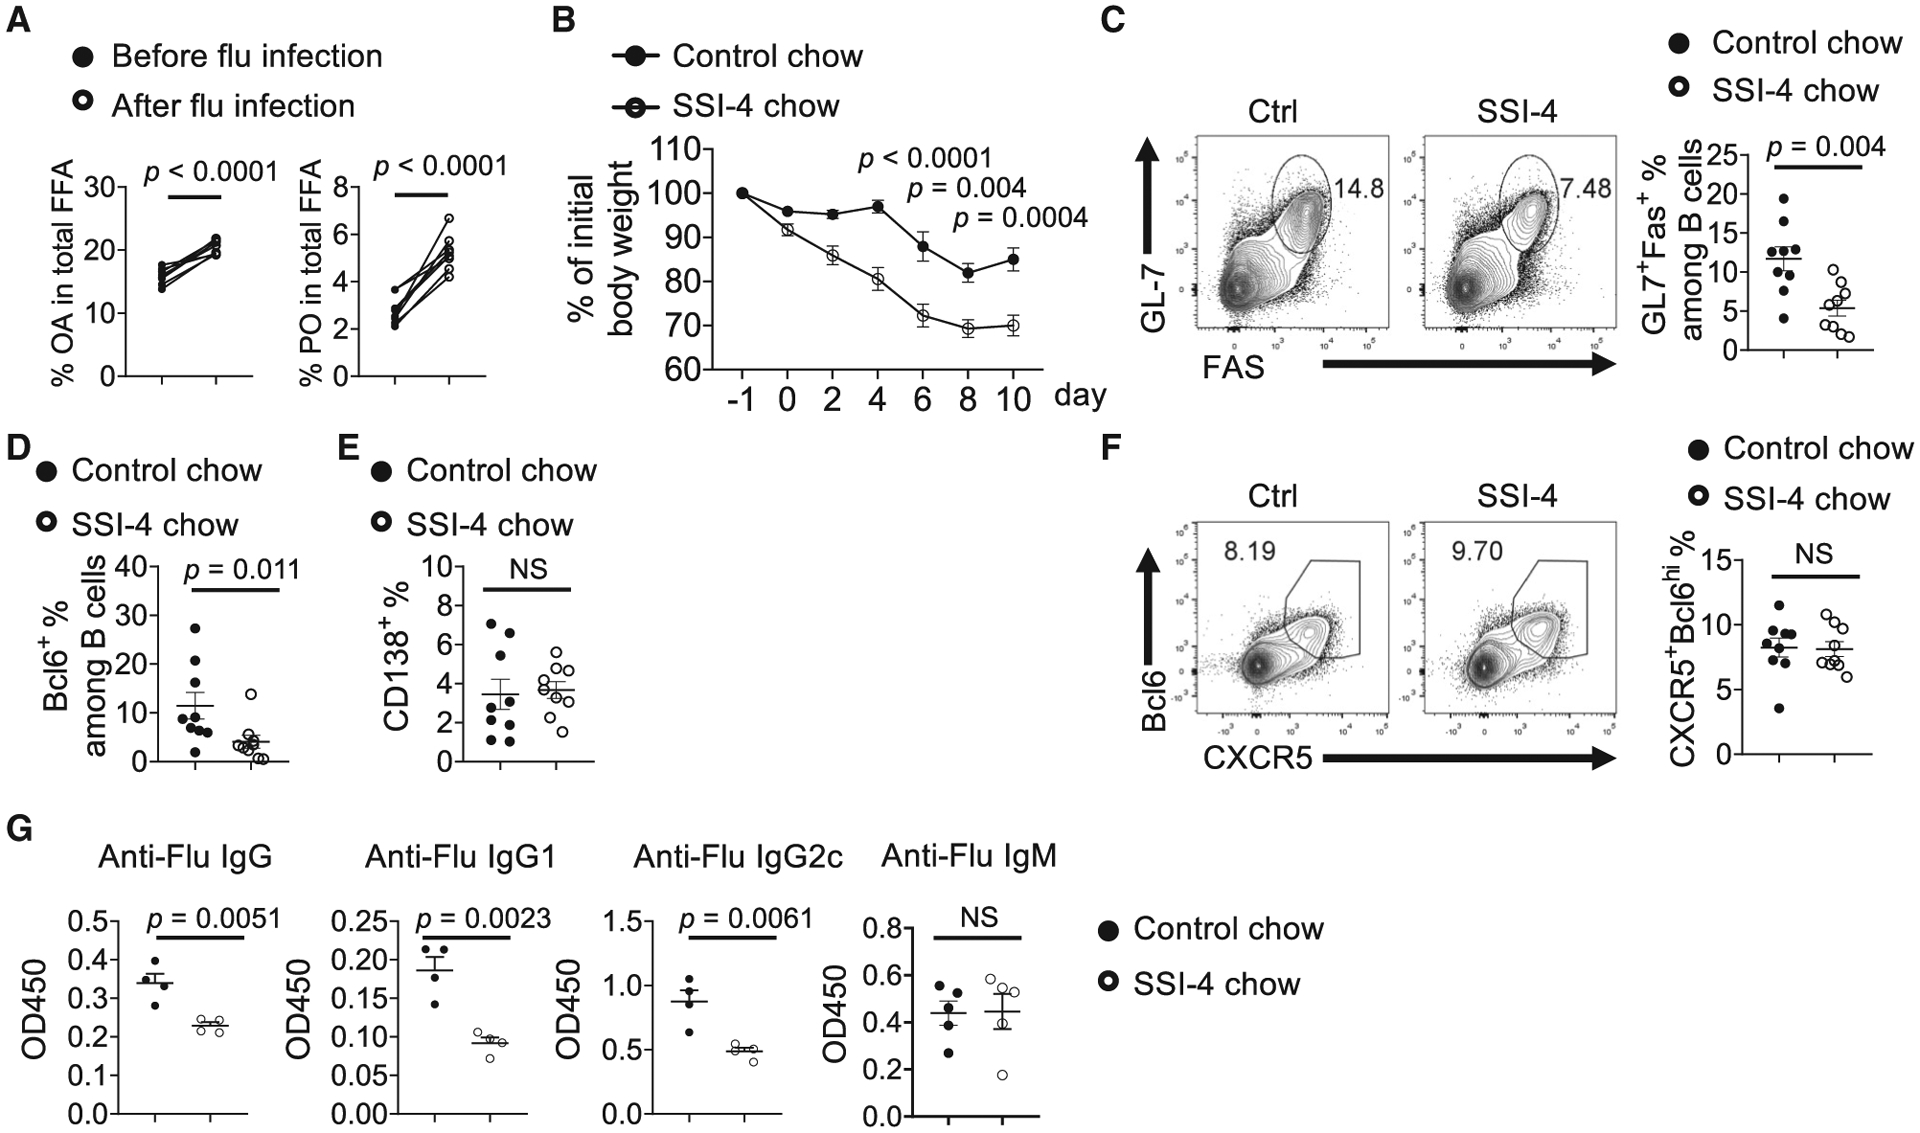
Figure 6. SCD Activity Is Required for Humoral Immunity against Influenza Infection.

(A) Composition of OA and PO among total free FAs in sera before and after influenza virus infection (n = 8).
(B) Body weight change in mice fed with control chow or SSI-4 chow for 1 week following influenza infection.
(C) Flow cytometry analysis of GC B cells in mediastinal lymph nodes at day 11 following infection. Right: the frequencies of GC B cells.
(D) The frequencies of Bcl6+ expression among B cells in mediastinal lymph nodes.
(E) The frequencies of B220intCD138+ plasmablasts.
(F) Flow cytometry analysis of Tfh cells in mediastinal lymph nodes. Right: the frequencies of CXCR5+Bcl6hi Tfh among CD4+ T cells in mediastinal lymph nodes.
(G) Influenza virus-specific antibodies IgG, IgG1, IgG2c, and IgM in sera were measured using ELISA.
p values were calculated using Student’s t test (A–G). Results are representative of three (B–G) independent experiments. Error bars represent SEM.
