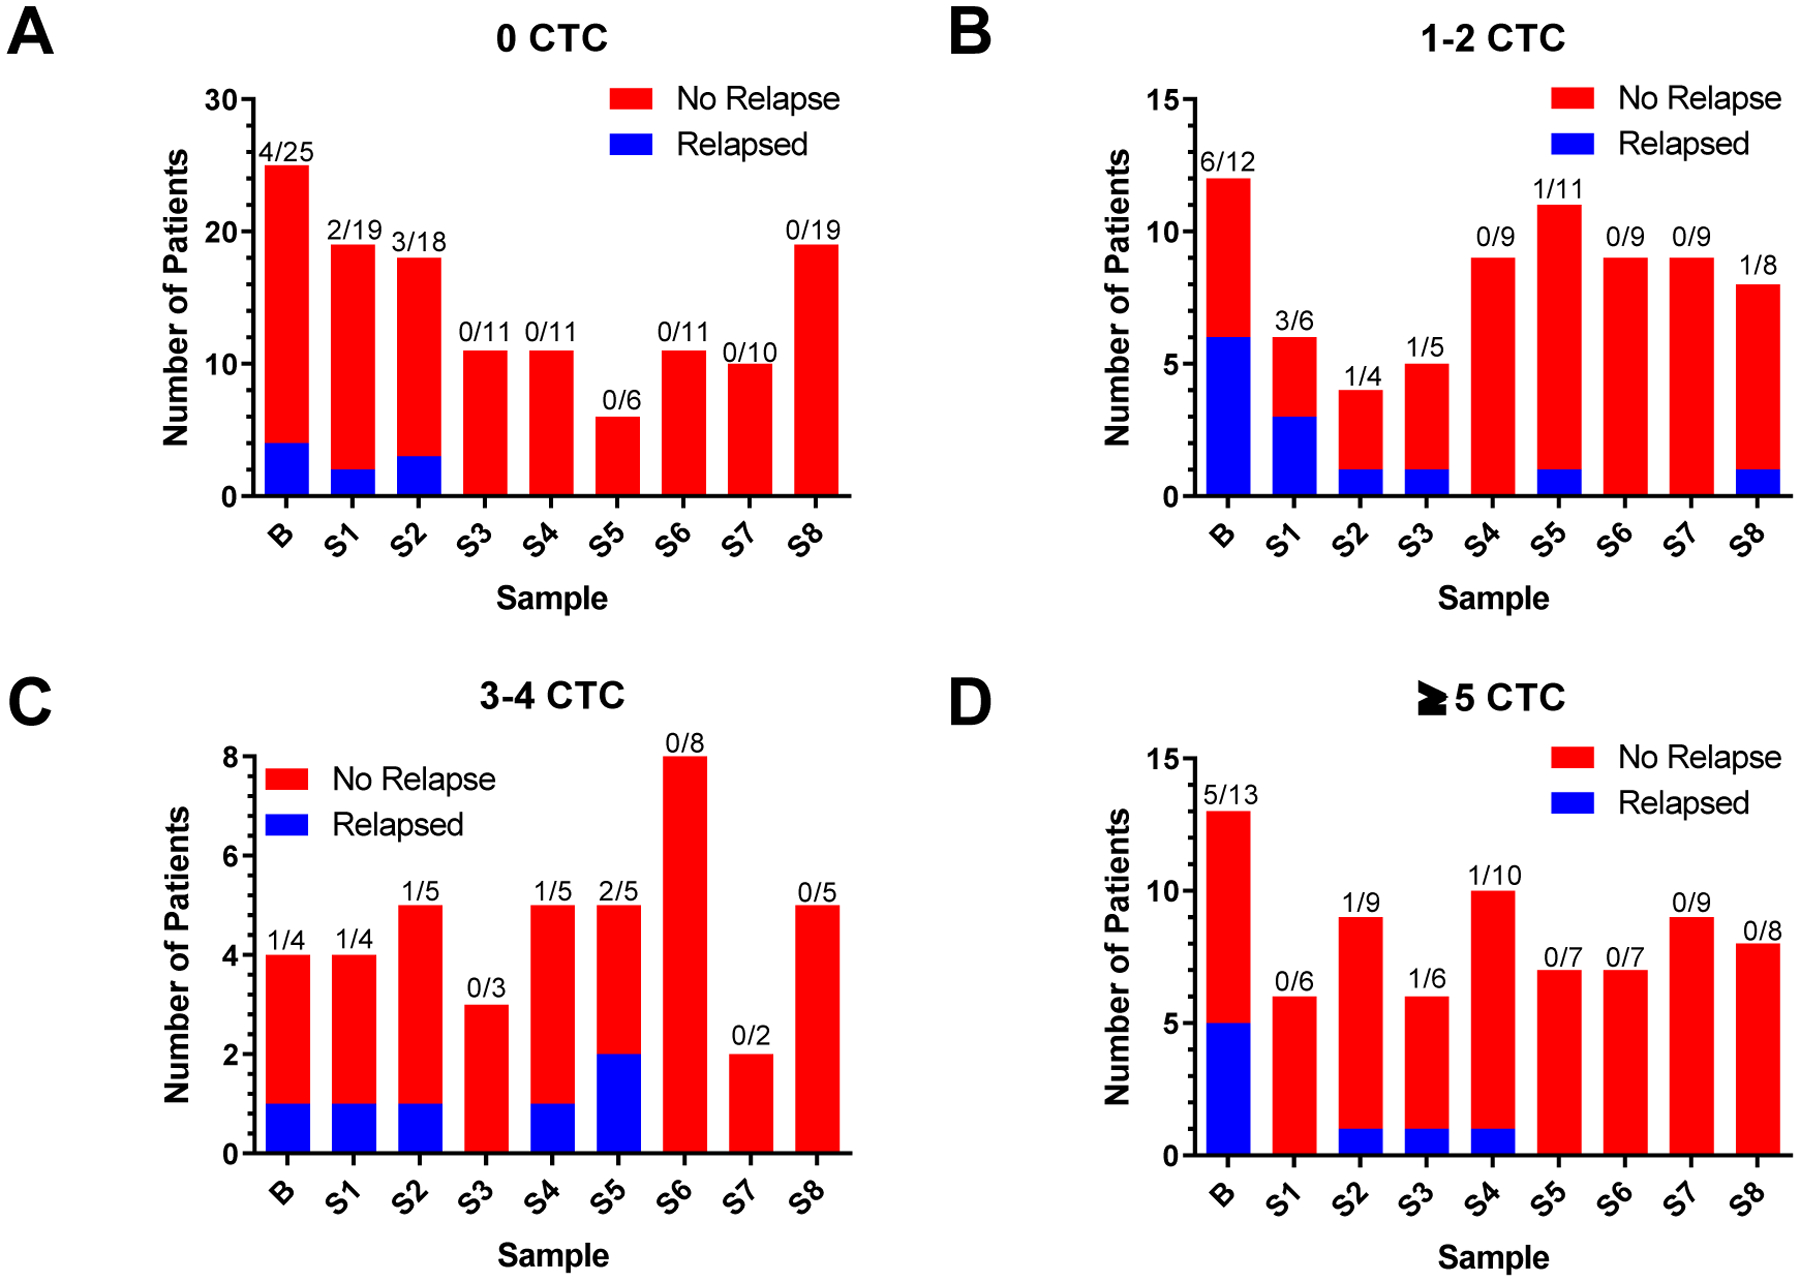
Figure 4.

Treatment monitoring in pool of patients. Each panel represents the number of patients that relapsed or not. Panels differ based on number of detected CTCs in each pool as indicated in the title of each graph. a Number of patients with 0 CTC who did or did not relapse at the indicated cycles. b Number of patients with 1 to 2 CTCs who did or did not relapse at the indicated cycles. c Number of patients with 3 to 4 CTCs who did or did not relapse at the indicated cycles. d Number of patients with ≥5 CTCs who did or did not relapse at the indicated cycles. B = Baseline. A Fisher exact test was performed on the B + S1 populations, p = 0.0278
