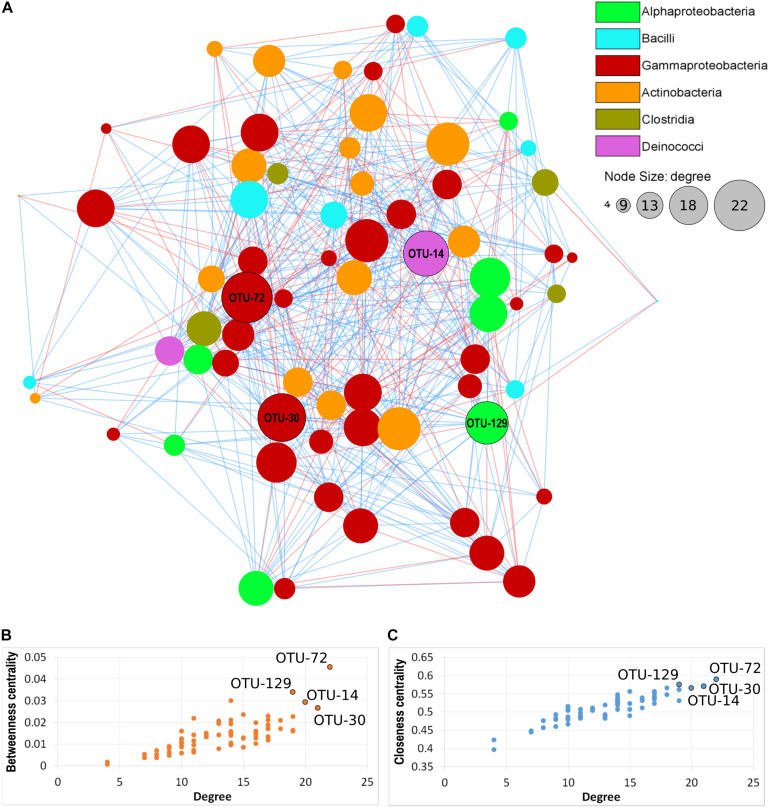
FIGURE 7.
Microbial co-occurrence network of the orchid microbiota. (A) Nodes represent OTUs, edges represent positive (blue lines) or negative (red lines) correlations. Node size indicates the degree (number of connections) and node color indicate the taxonomical class, according to the legend. Labeled nodes represent the hub OTUs. (B,C) Connectivity scores of the nodes, based on degree, betweenness centrality and closeness centrality, used to identify the hub OTUs (labeled nodes).

