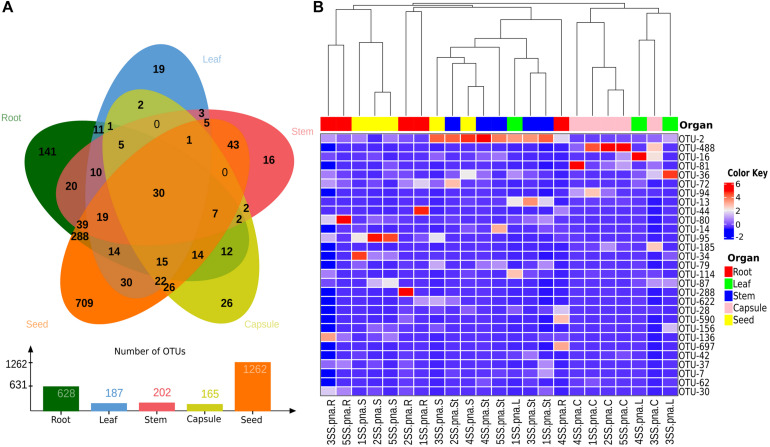
FIGURE 8.
Analyses of shared and major bacterial OTUs in the Spiranthes spiralis microbiota. (A) Venn diagram showing unique and shared OTUs between vegetative and reproductive organs (root, leaf, stem, capsule, seed). (B) Heatmap showing bacterial OTUs > 0.5% of the total sequences; samples were clustered by orchid organs (top row). Color Key from blue to red indicates increasing abundance in natural logarithm of counts, with OTUs along the Y-axis and samples along X-axis.

