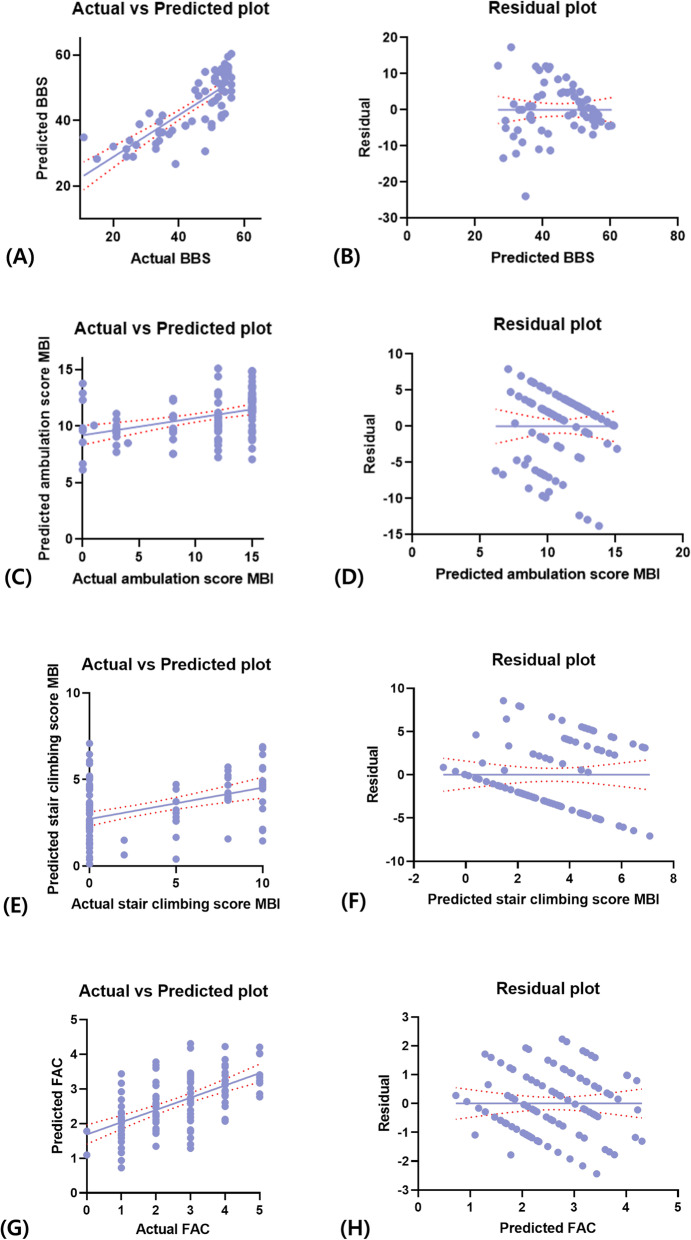
Fig. 1.
a-b Mean of the "actual vs. predicted plot" and the residual plot between the Berg balance scale (BBS) score and spatial parameters of gait (gait speed/height). c-d Mean of the "actual vs. predicted plot" and the residual plot between the ambulation sub-score of the modified Barthel index (MBI) and spatial parameters of gait (gait speed/height). e-f Mean of the "actual vs. predicted plot" and the residual plot between the stair-climbing sub-score of the MBI and spatial parameters of gait (gait speed/height). g-h Mean of the "actual vs predicted plot" and the residual plot between the functional ambulation category (FAC) and spatial parameters of gait (gait speed/height)

