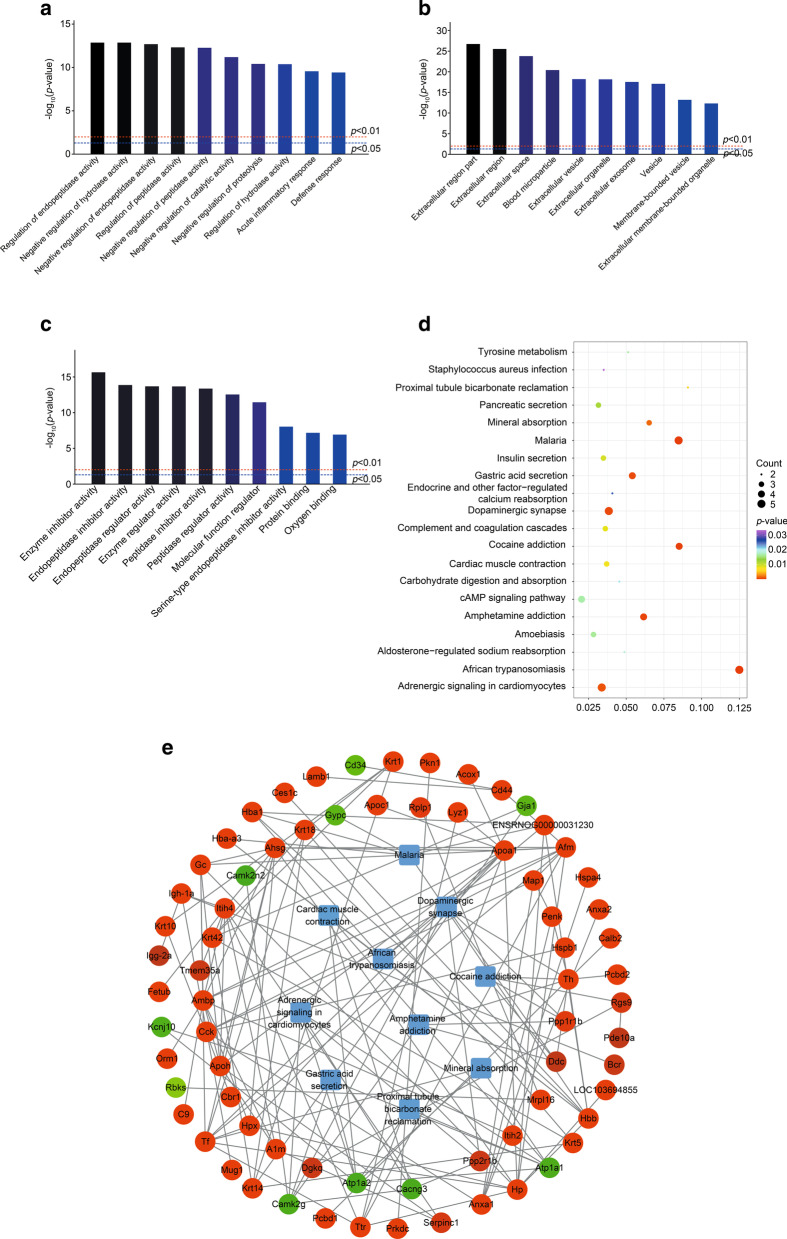
Fig. 3.
Bioinformatic analysis for differentially expressed proteins in the TBI and sham rats. a Biological process (BP). b cell components (CC). c molecular function (MF). Darker colors indicate higher statistical significancy. d Bubble chart shows KEGG analysis of differential genes. The horizontal axis represents rich factor (ratio of the sum of differential genes enriched in a pathway to the number of genes annotated by the pathway). Bubble size indicates the number of proteins included in each pathway, and different colors indicate different p-values. e Protein–protein interaction (red = upregulated protein; green = downregulated protein). Rounded rectangles represent KEGG pathways. Lines show interactions between multiple proteins or between proteins and pathways

