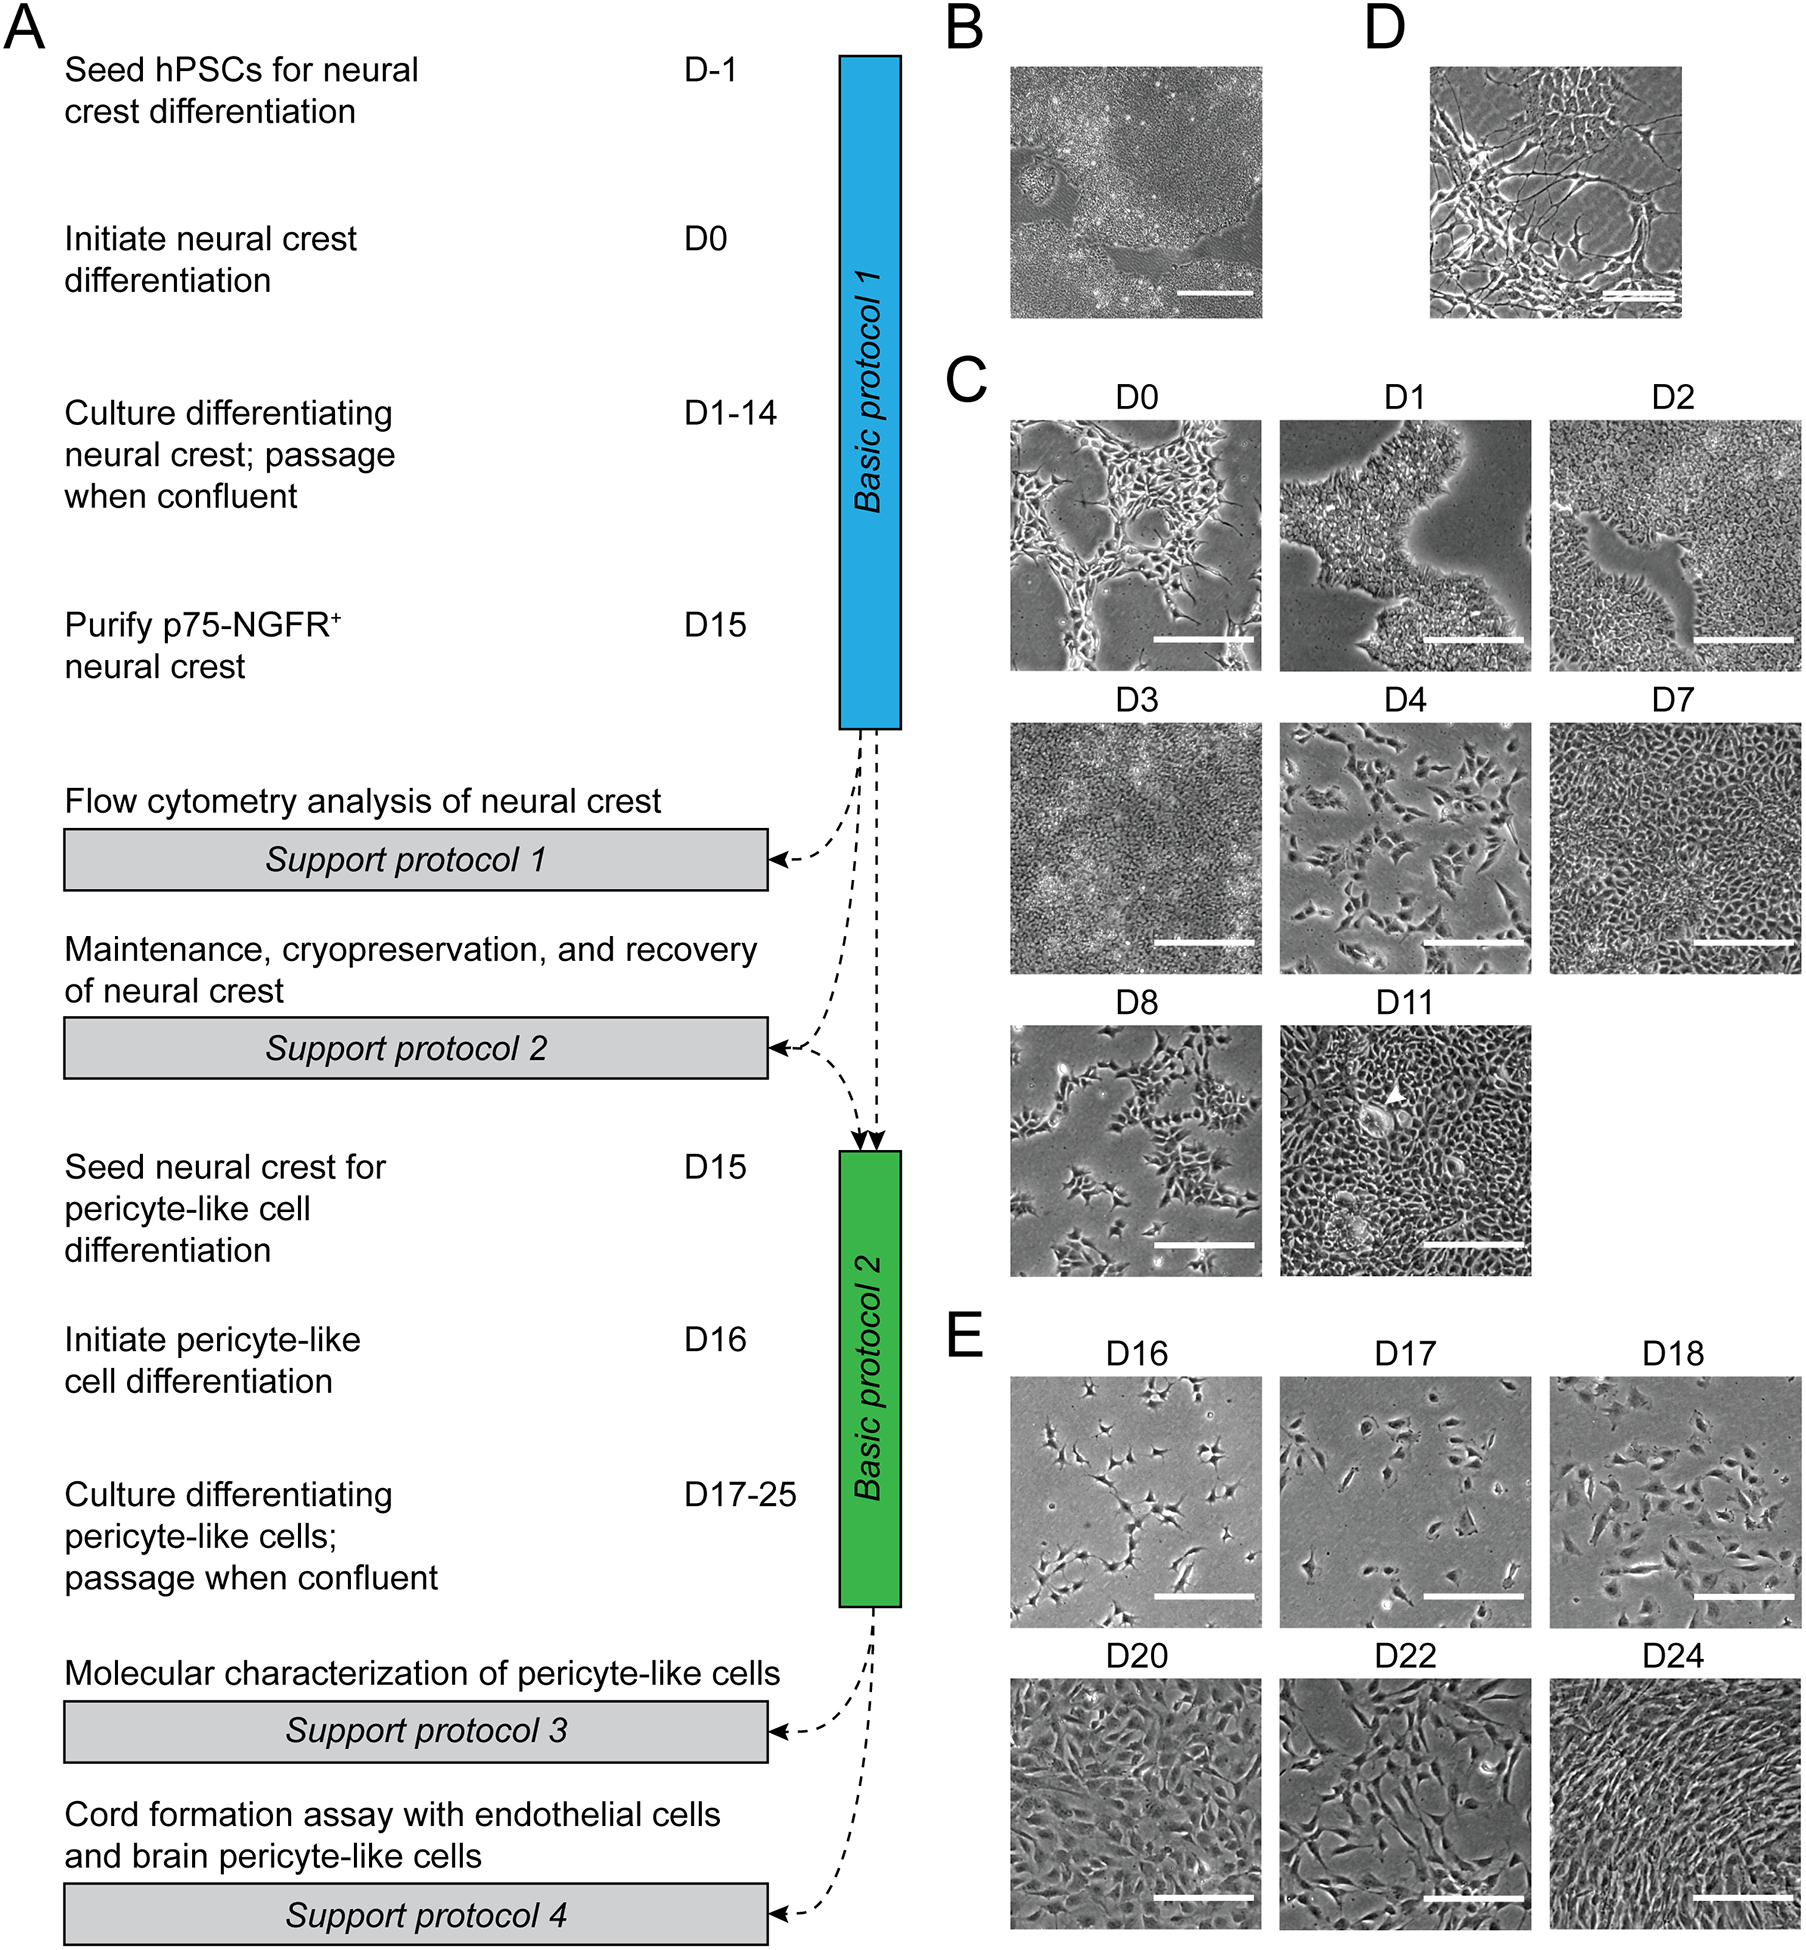
Figure 1. Protocol overview.

(A) Schematic of protocol steps and timing. (B) Brightfield image of hPSC colony morphology at a density appropriate for seeding. Scale bar: 500 μm. (C) Brightfield images of typical cell morphology during the differentiation of hPSCs to neural crest. Arrowhead indicates a non-neural crest colony. Scale bars: 200 μm. (D) Example of spontaneous differentiation in a maintained neural crest culture. Scale bar: 100 μm. (E) Brightfield images of typical cell morphology during the differentiation of neural crest to brain pericyte-like cells. Scale bars: 200 μm.
