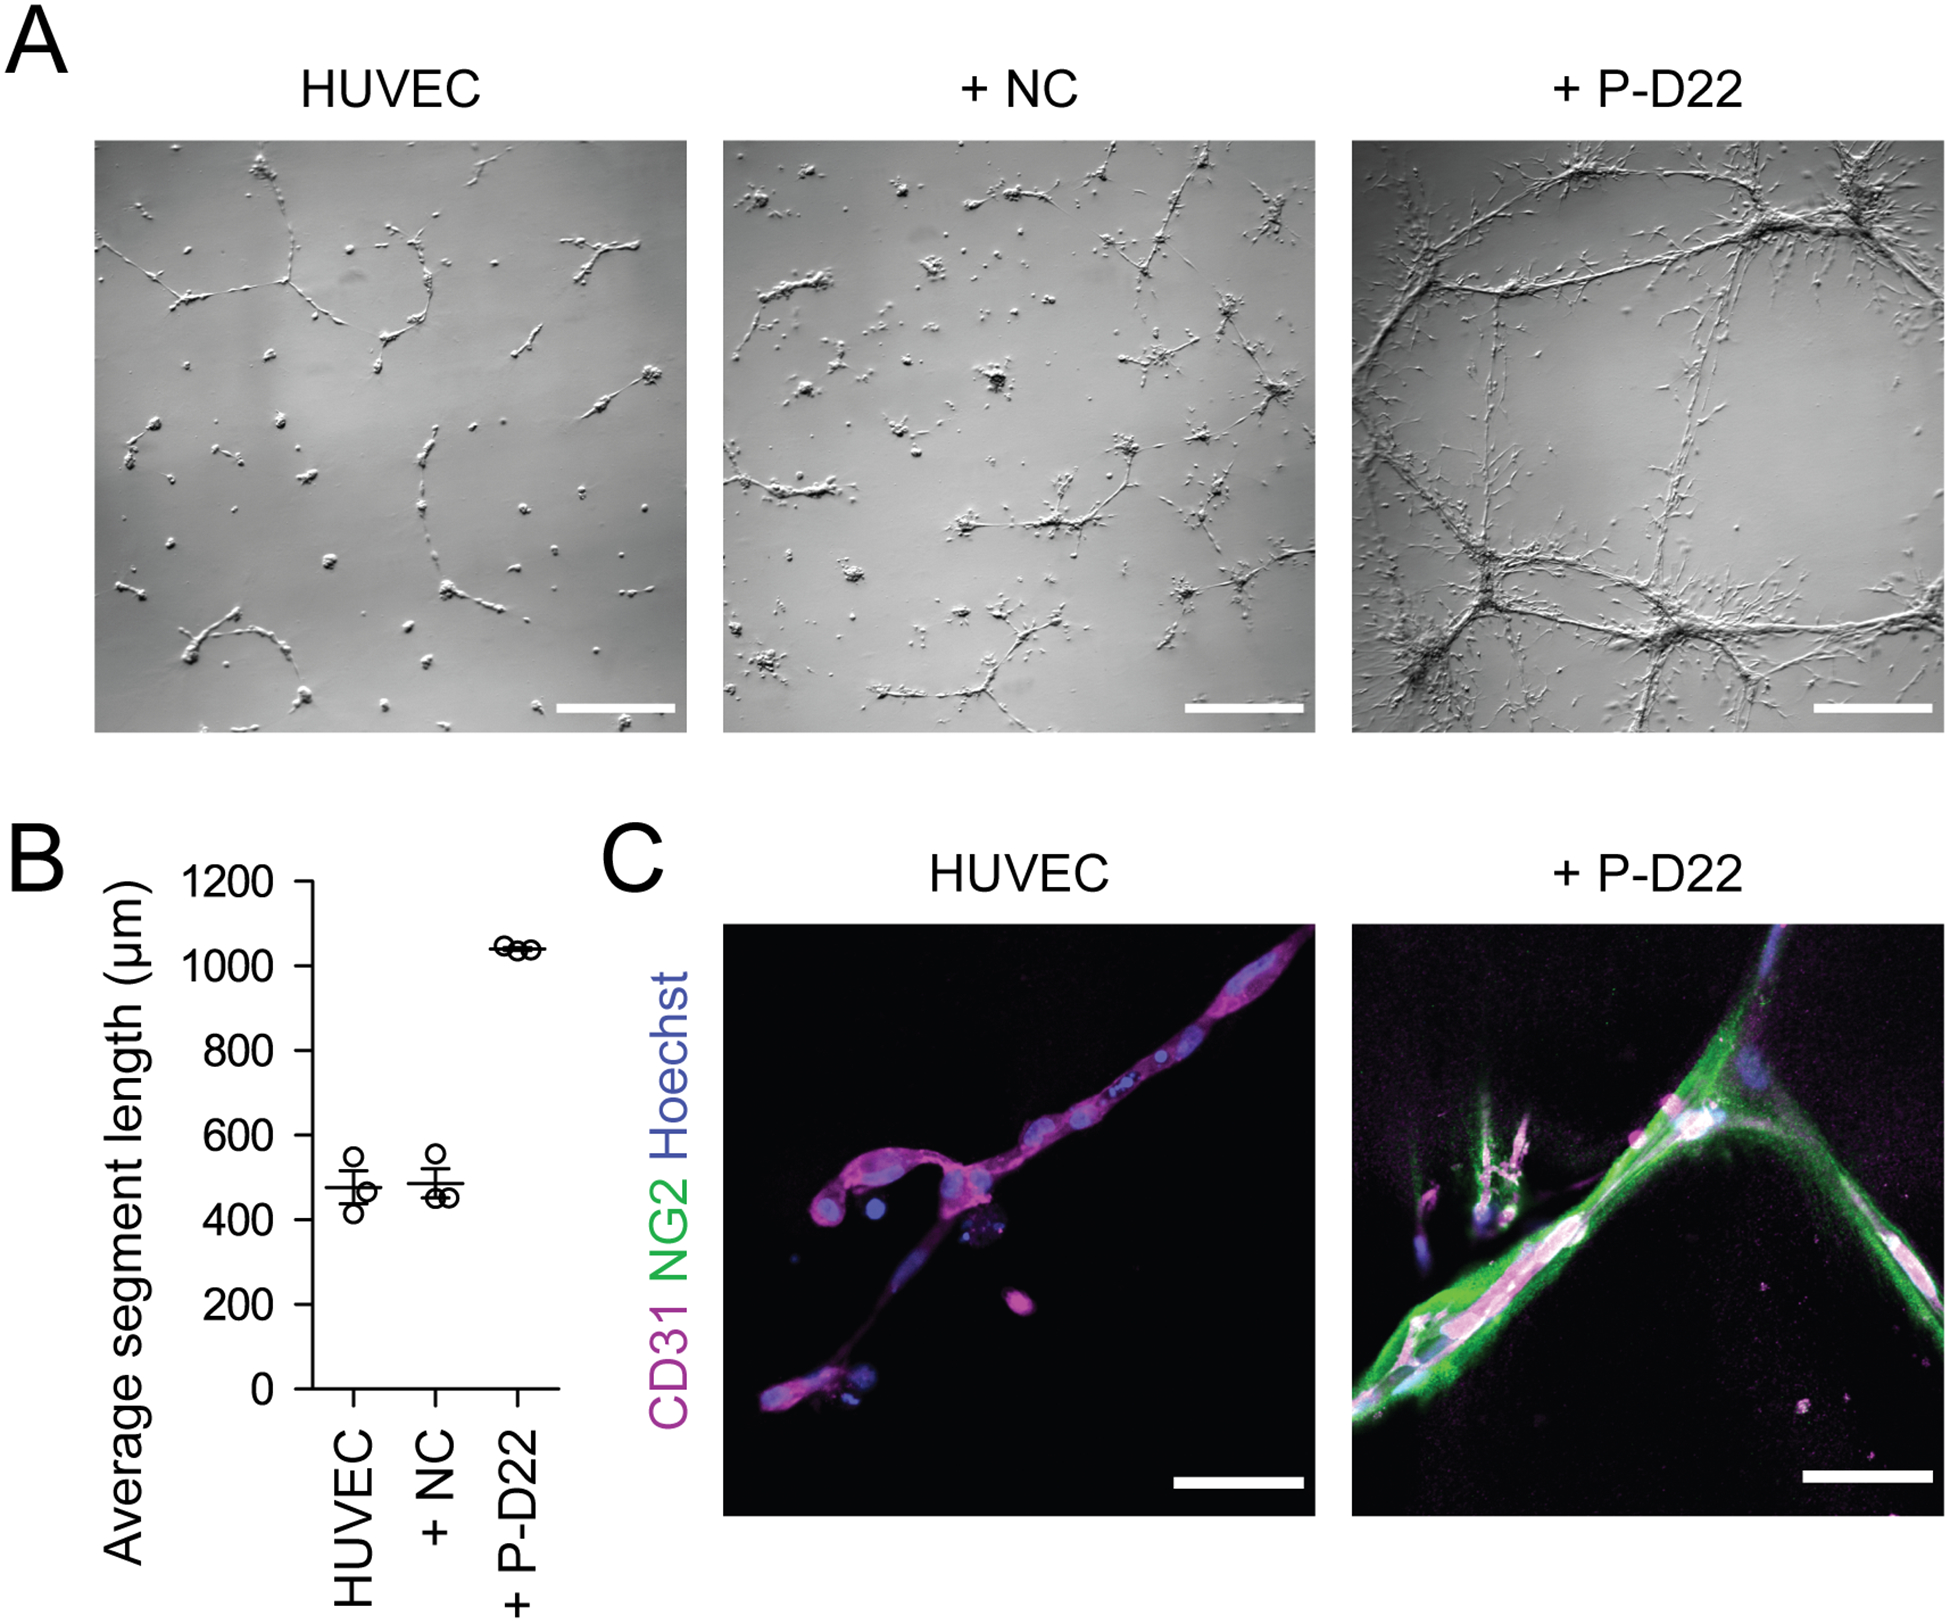
Figure 4. Expected results of cord formation assay.

(A) Phase contrast images of cells 24 h after initiating cord formation. Images of HUVECs alone, HUVECs cocultured with neural crest cells (+ NC), and HUVECs cocultured with brain pericyte like cells at D22 (+ P-D22) are shown. Scale bars: 1 mm. (B) Quantification of average segment length for the cord formation assay conditions described in (A). Error bars represent the standard deviation of three replicate chambers. (C) Confocal immunocytochemistry analysis of cords from HUVEC and + P-D22 conditions stained for CD31 and NG2. Hoechst nuclear counterstain is also shown. Scale bars: 50 μm.
