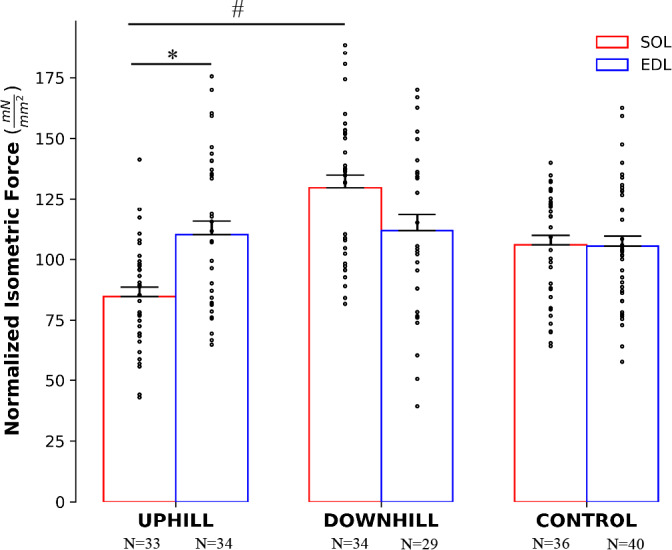
FIGURE 2.

Normalized isometric force in the uphill, downhill, and control groups. The red bars represent the SOL muscle and the blue bars represent the EDL muscle. Within the uphill group, the EDL produced 18.9% more force than the SOL (p < .001). Within the SOL, the uphill group produced 37.4% less force as compared with the downhill group (p = .008). Mean ± SEM. *Effect of muscle. #Effect of group
