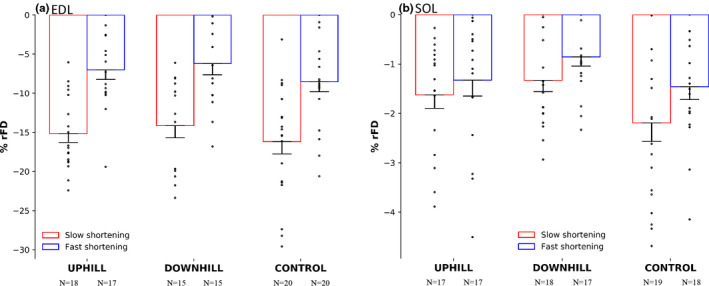
FIGURE 5.

%rFD in the uphill, downhill, and control group of the EDL muscle (a) and SOL muscle (b). The red bars represent a slow shortening speed and the blue bars represent a fast shortening speed. The EDL had 81.1% and 88.7% more %rFD during both the fast and slow speed as compared with the SOL respectively. Mean ± SE
