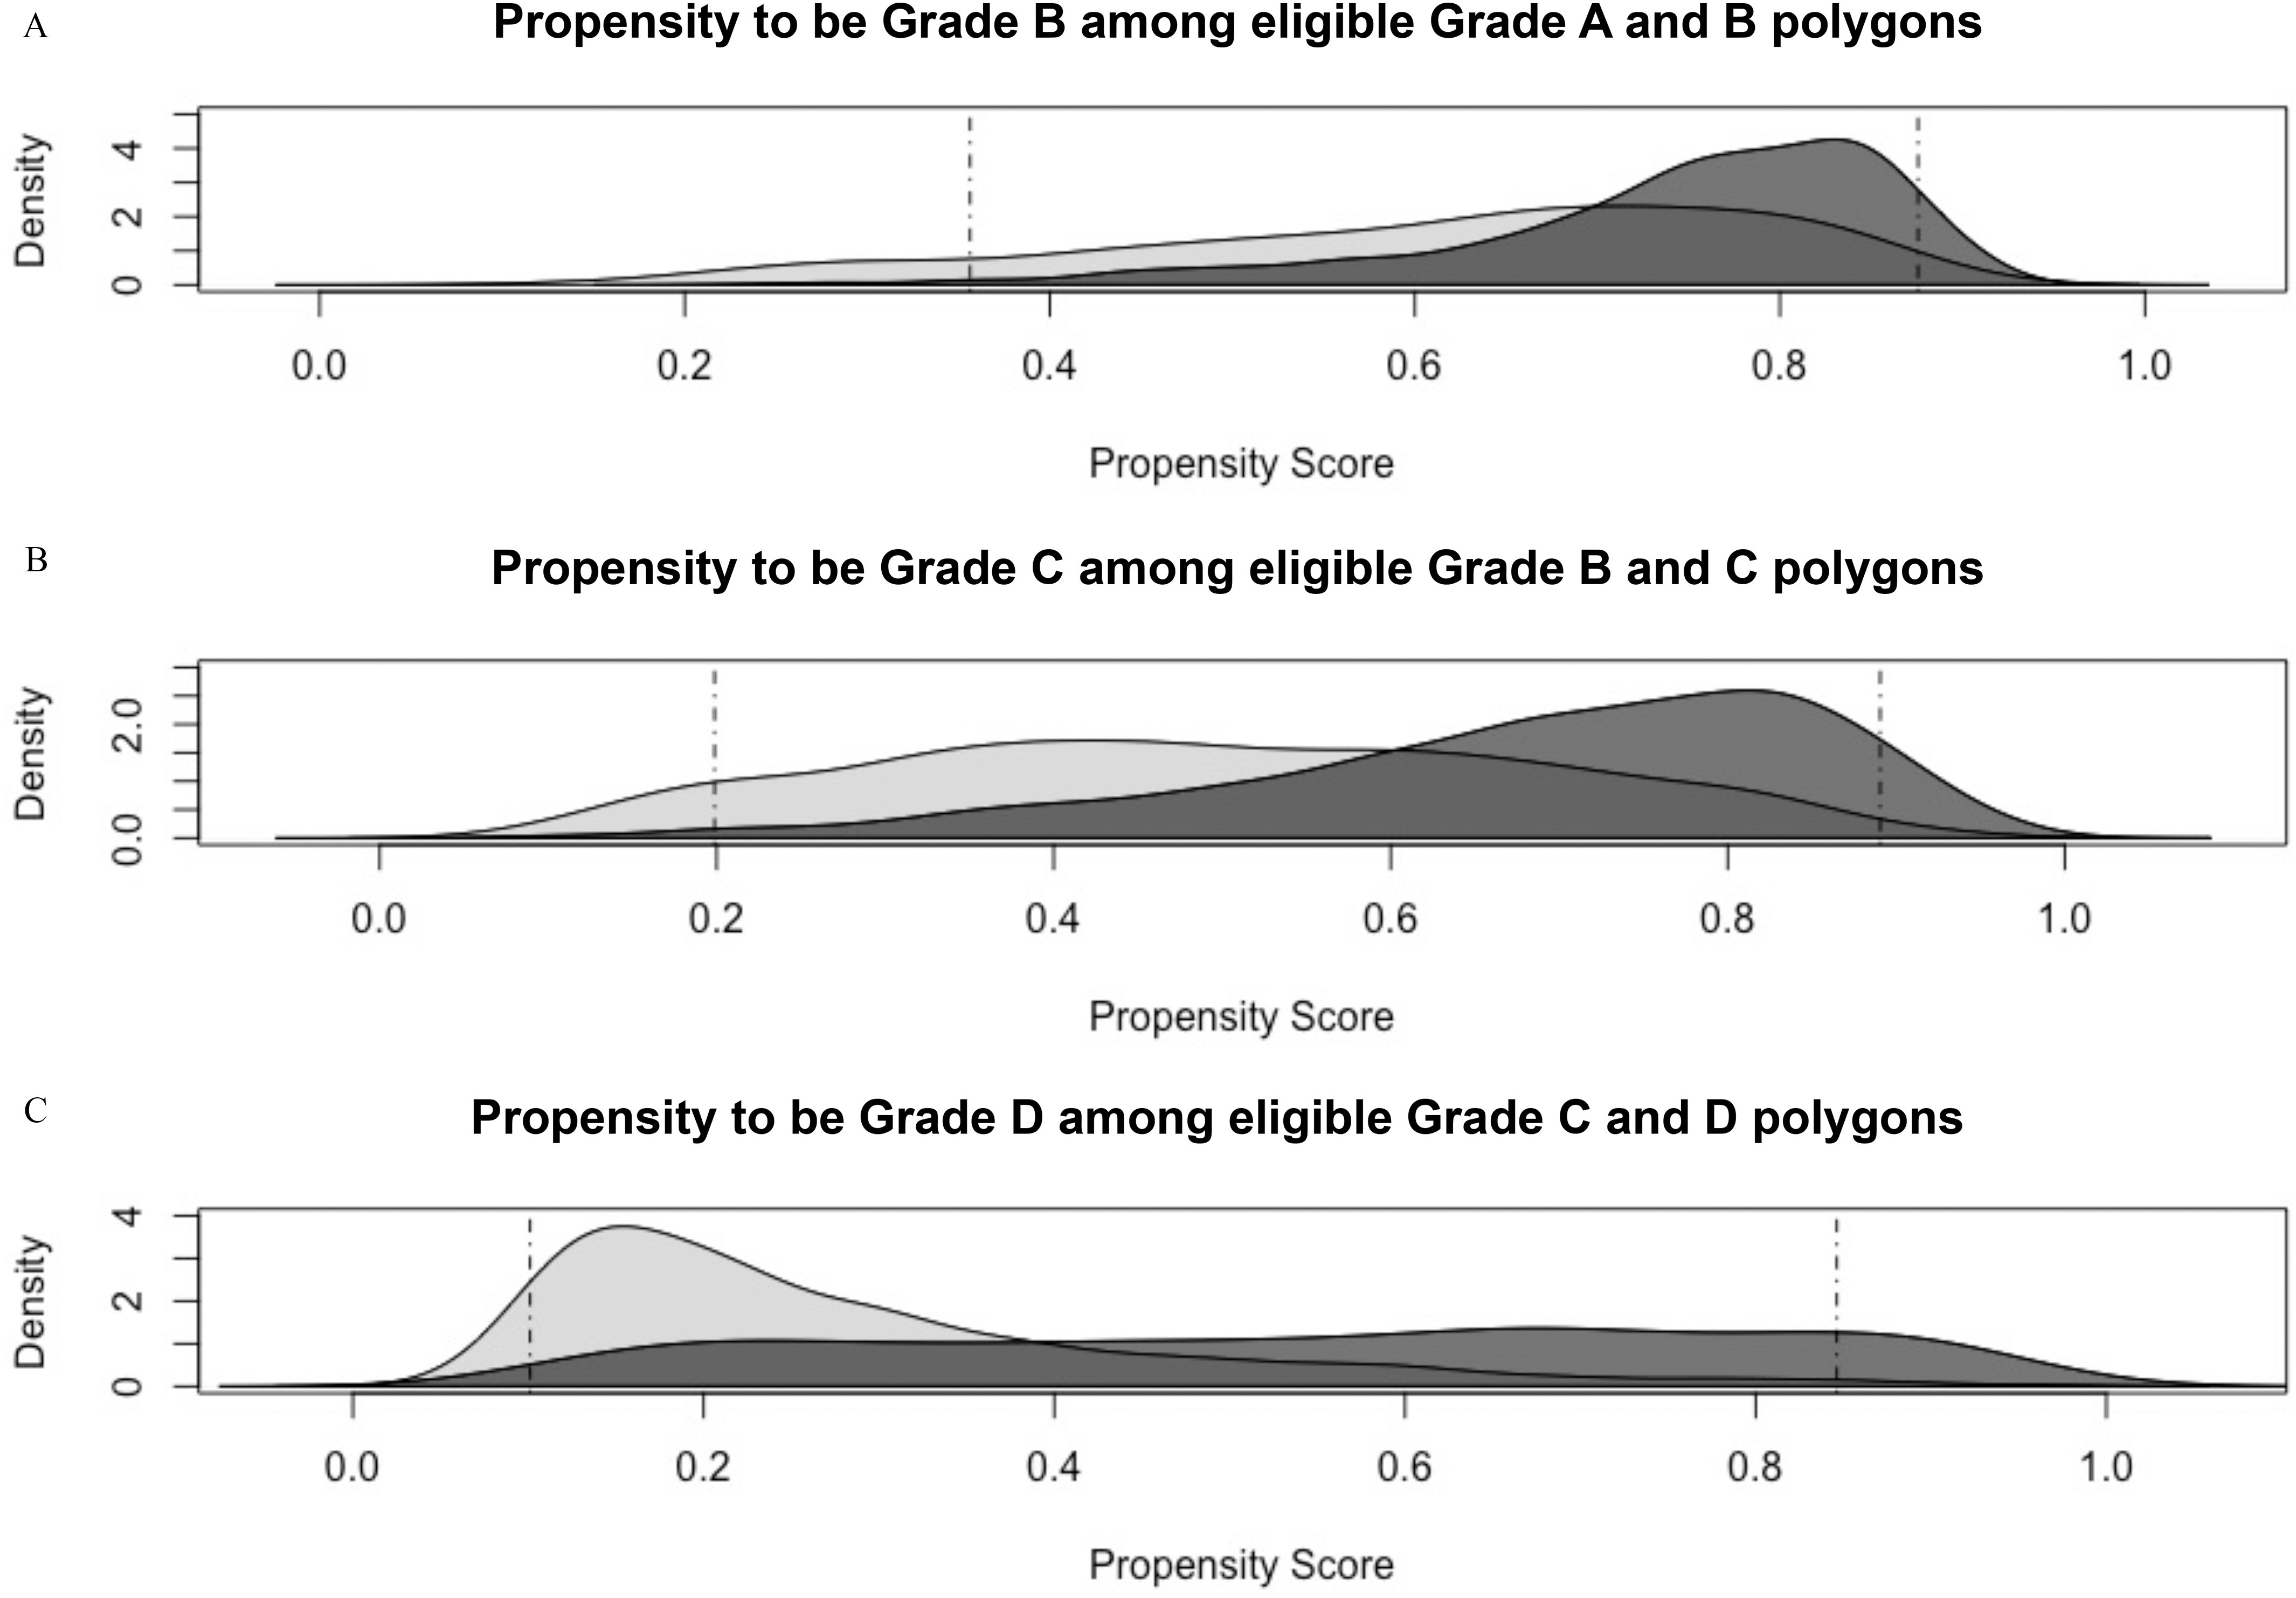
Figure 1.

Nonrestricted propensity score distributions for 1940s U.S. Census tracts comparing HOLC better-graded tracts to worse-graded tracts. Propensity scores of the worse-graded group are shaded darker. (A) Propensity to be Grade B among Grades A and B HOLC neighborhoods; (B) propensity to be Grade C among Grades B and C HOLC neighborhoods; and (C) propensity to be Grade D among Grades C and D neighborhoods. Subsequent propensity score restriction cutoffs (1st and 99th percentiles) are indicated by the dashed lines. Note: HOLC, Home Owners’ Loan Corporation.
