. 2021 Jan 27;129(1):017006. doi: 10.1289/EHP7495

Figure 2.

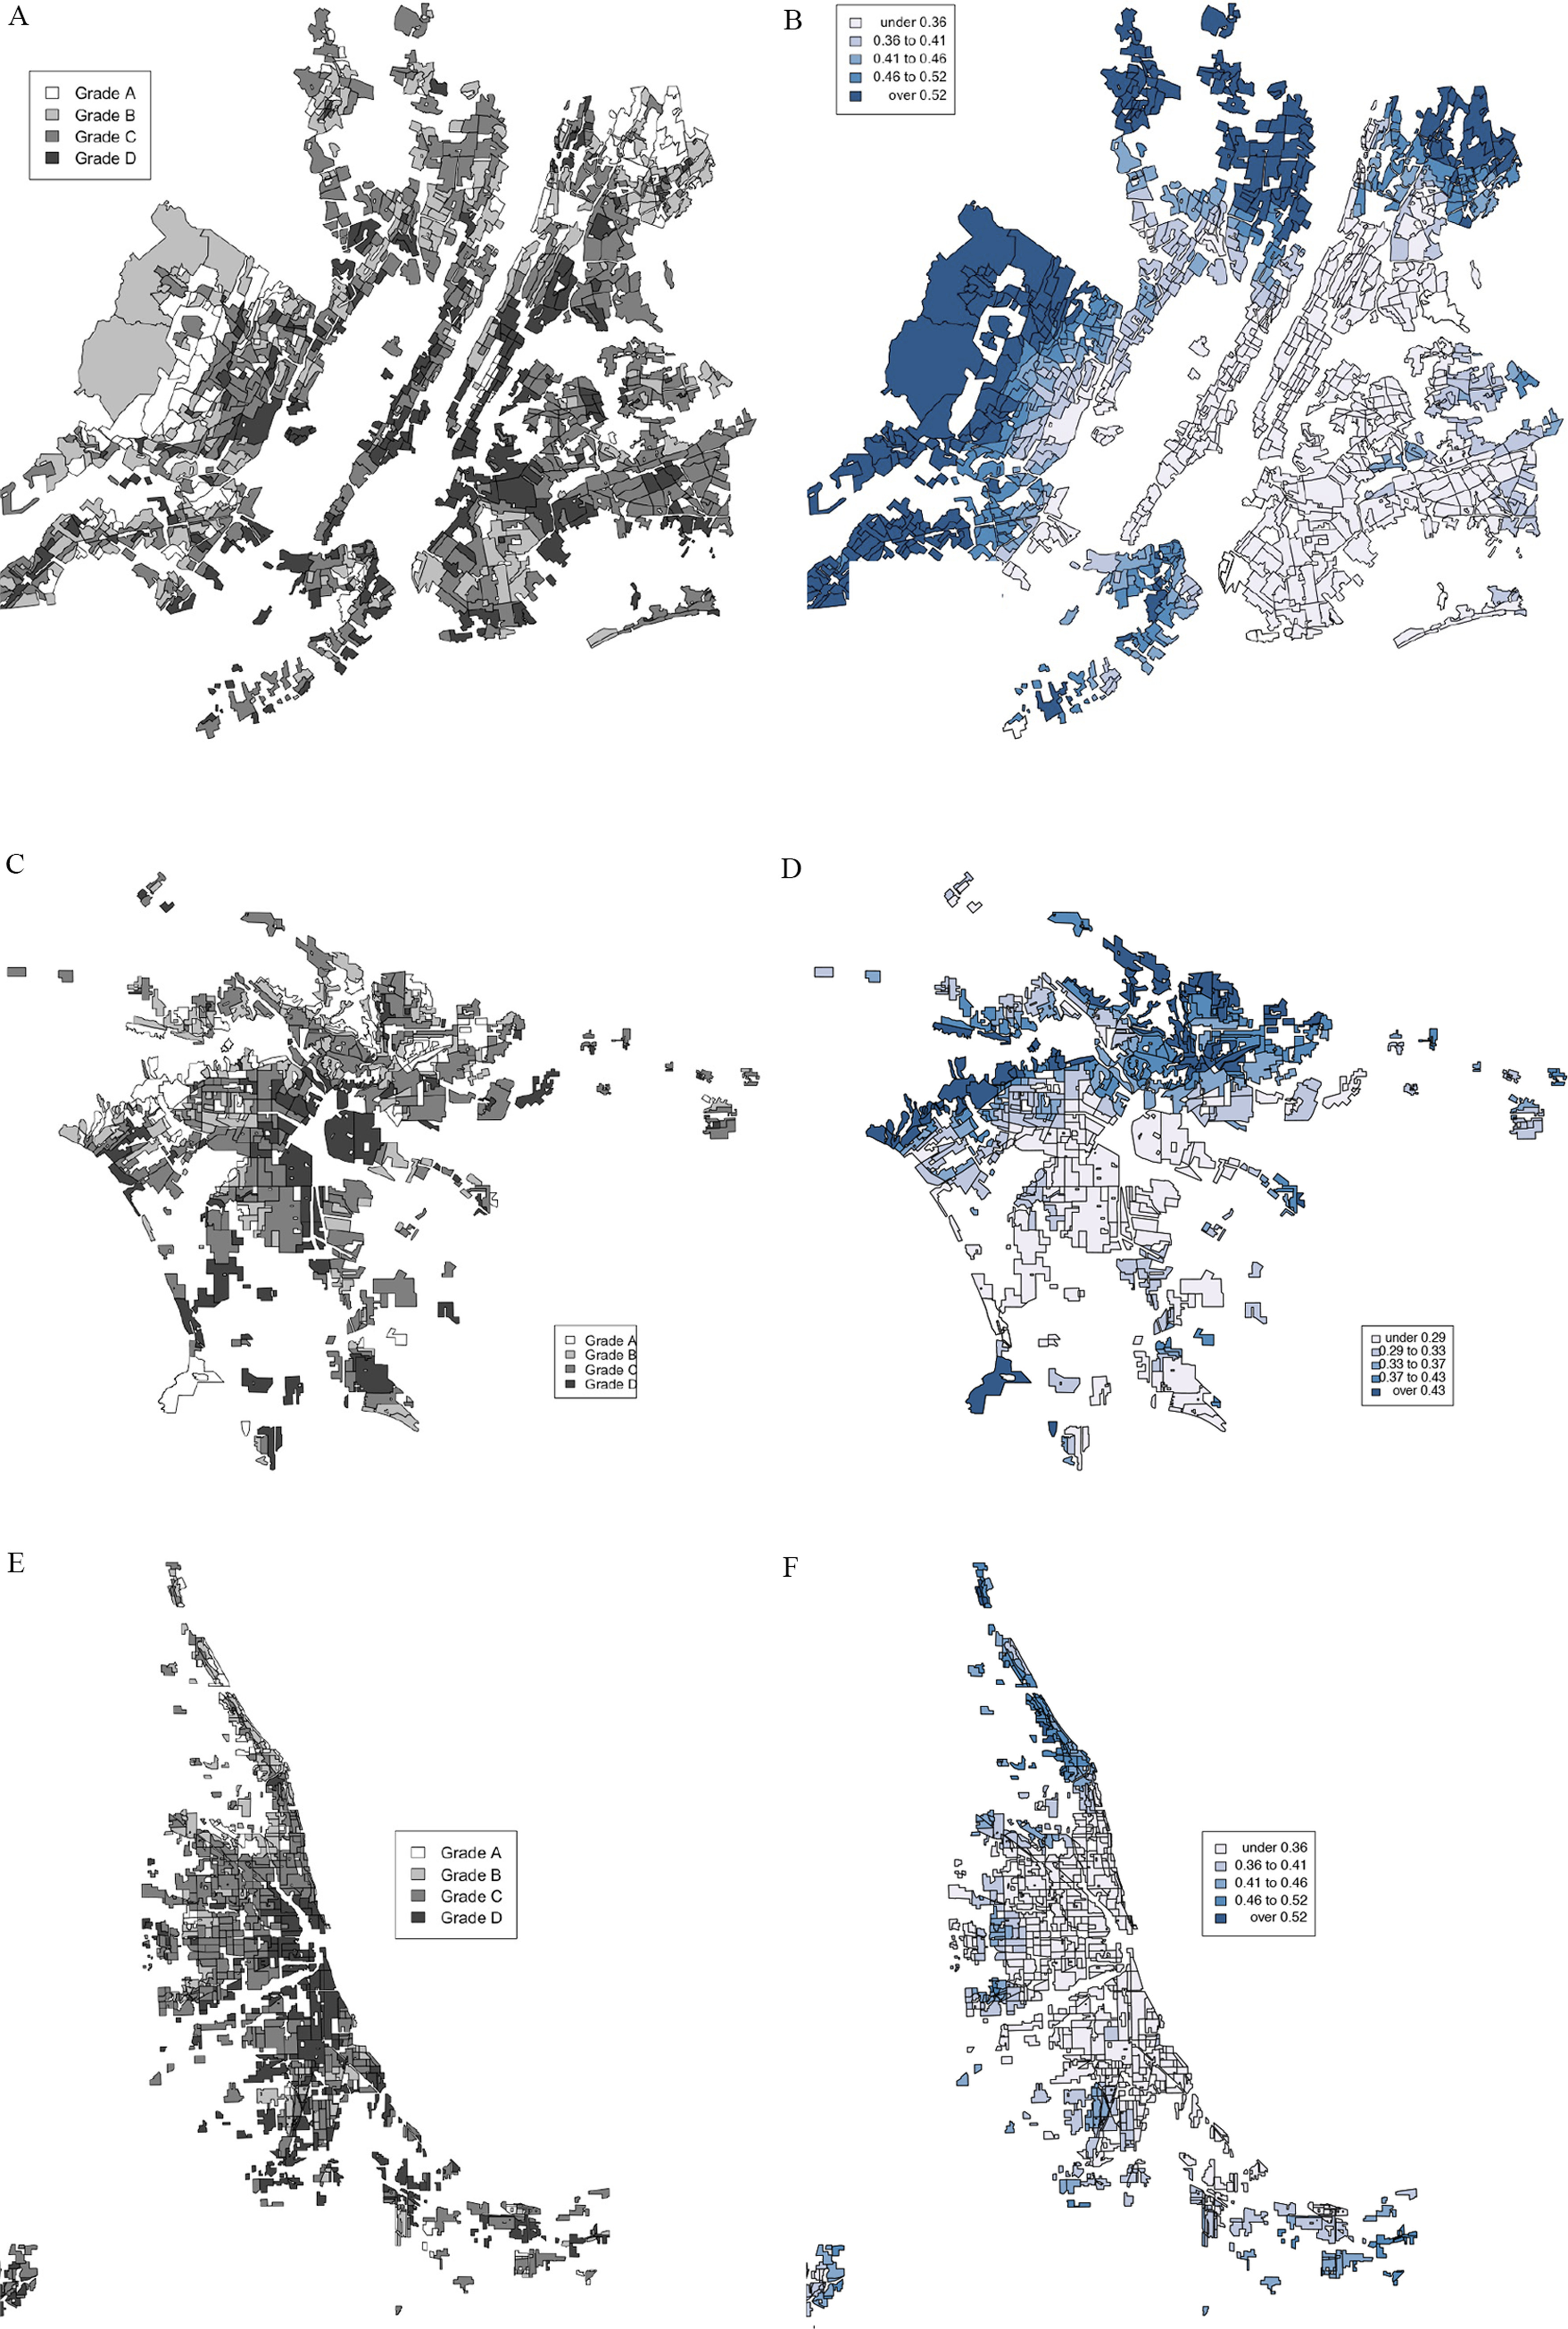
Figures 2A and 2B are maps of the New York City metropolitan area, Figures 2C and 2D are maps of the Los Angeles metropolitan area, and Figures 2E and 2F are maps of the Chicago metropolitan area. Figures 2A, 2C, and 2E plot Home Owners’ Loan Corporation grades A, B, C, and D. Figures 2B and 2F plot Ecoregion-specific 2010 Normalized Difference Vegetation Index for under 0.36, 0.36 to 0.41, 0.41 to 0.46, 0.46 to 0.52, and over 0.52, and Figure 2D plots Ecoregion-specific 2010 Normalized Difference Vegetation Index for under 0.29, 0.29 to 0.33, 0.33 to 0.37, 0.37 to 0.43, and over 0.43.

Ecoregion-specific normalized difference vegetation index (NDVI) quintiles in all HOLC polygons across the Chicago, Los Angeles, and New York City urban areas. Images (A, C, E) in the left column are assigned HOLC grades. Images (B, D, F) in the right column are 2010 NDVI quintiles, with the deeper shade of blue indicating higher levels of greenness. (A) and (B) corresponds to the New York City metropolitan area. (C) and (D) corresponds to the Los Angeles metropolitan area. (E) and (F) corresponds to the Chicago metropolitan area. Note: HOLC, Home Owners’ Loan Corporation.