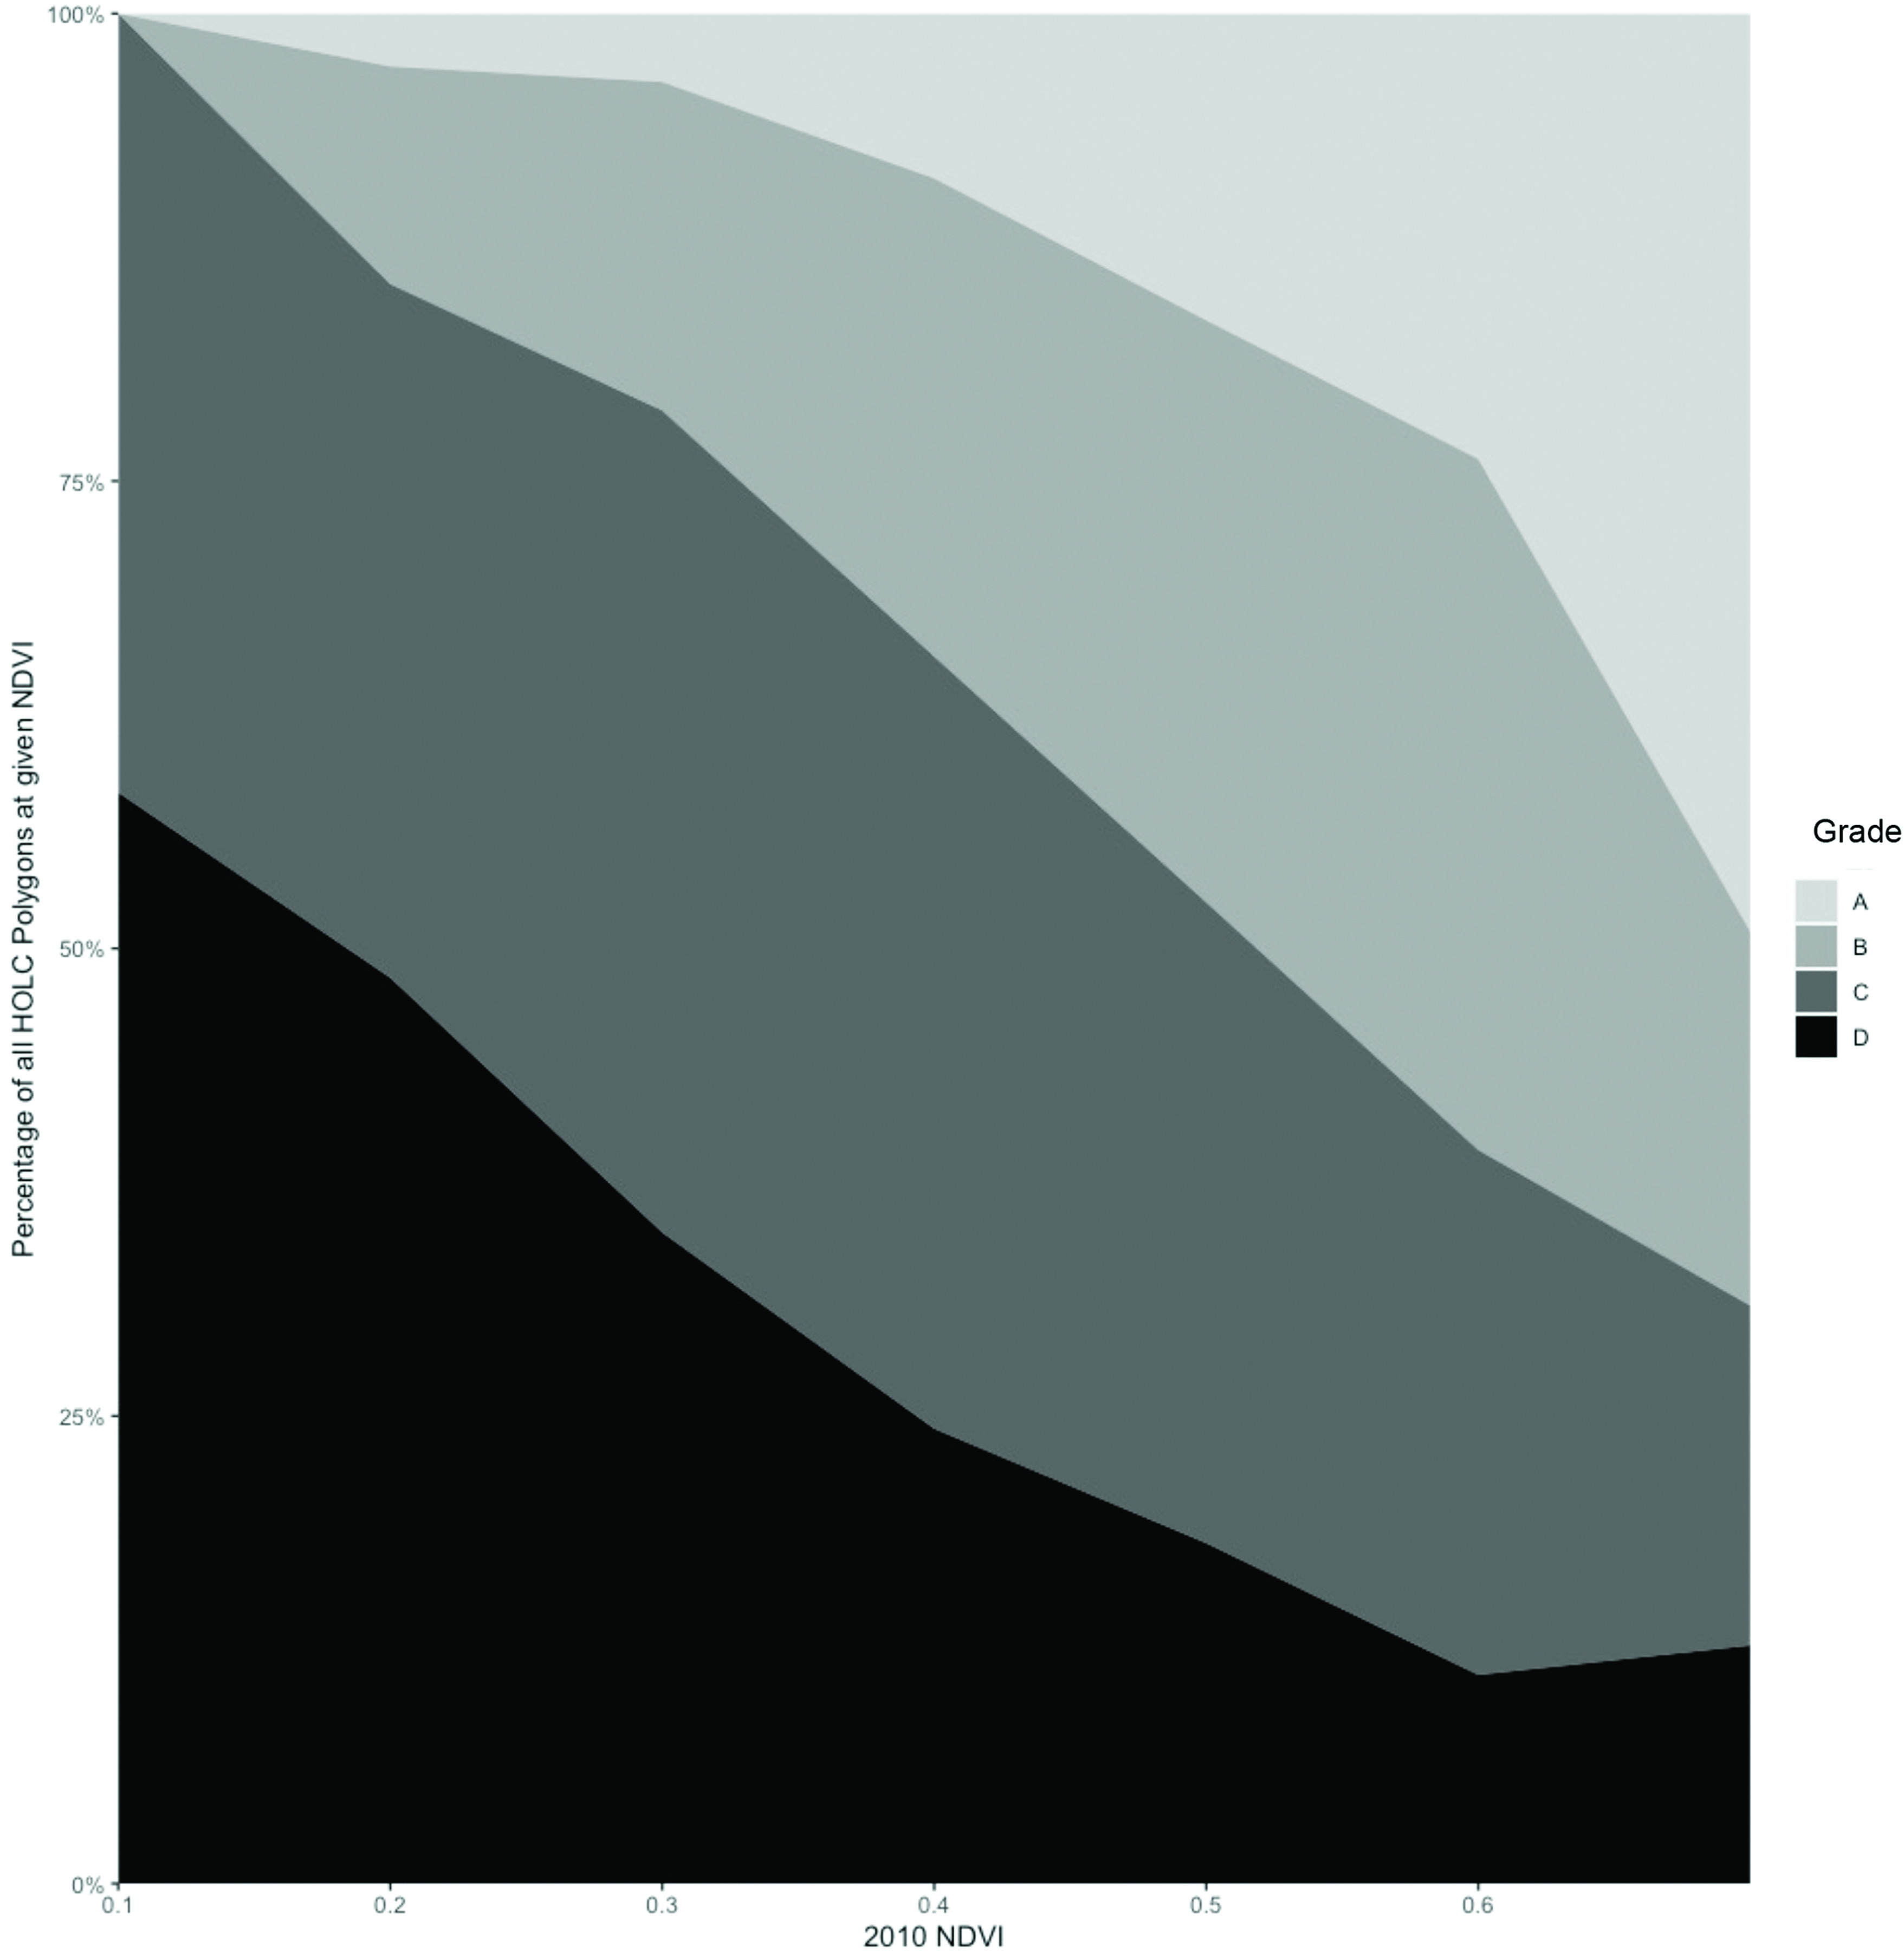
Figure 3.

Percentage of all HOLC polygons at a given mean annual 2010 NDVI stratified by HOLC grade. Note: HOLC, Home Owners’ Loan Corporation; NDVI, normalized difference vegetation index.

Percentage of all HOLC polygons at a given mean annual 2010 NDVI stratified by HOLC grade. Note: HOLC, Home Owners’ Loan Corporation; NDVI, normalized difference vegetation index.