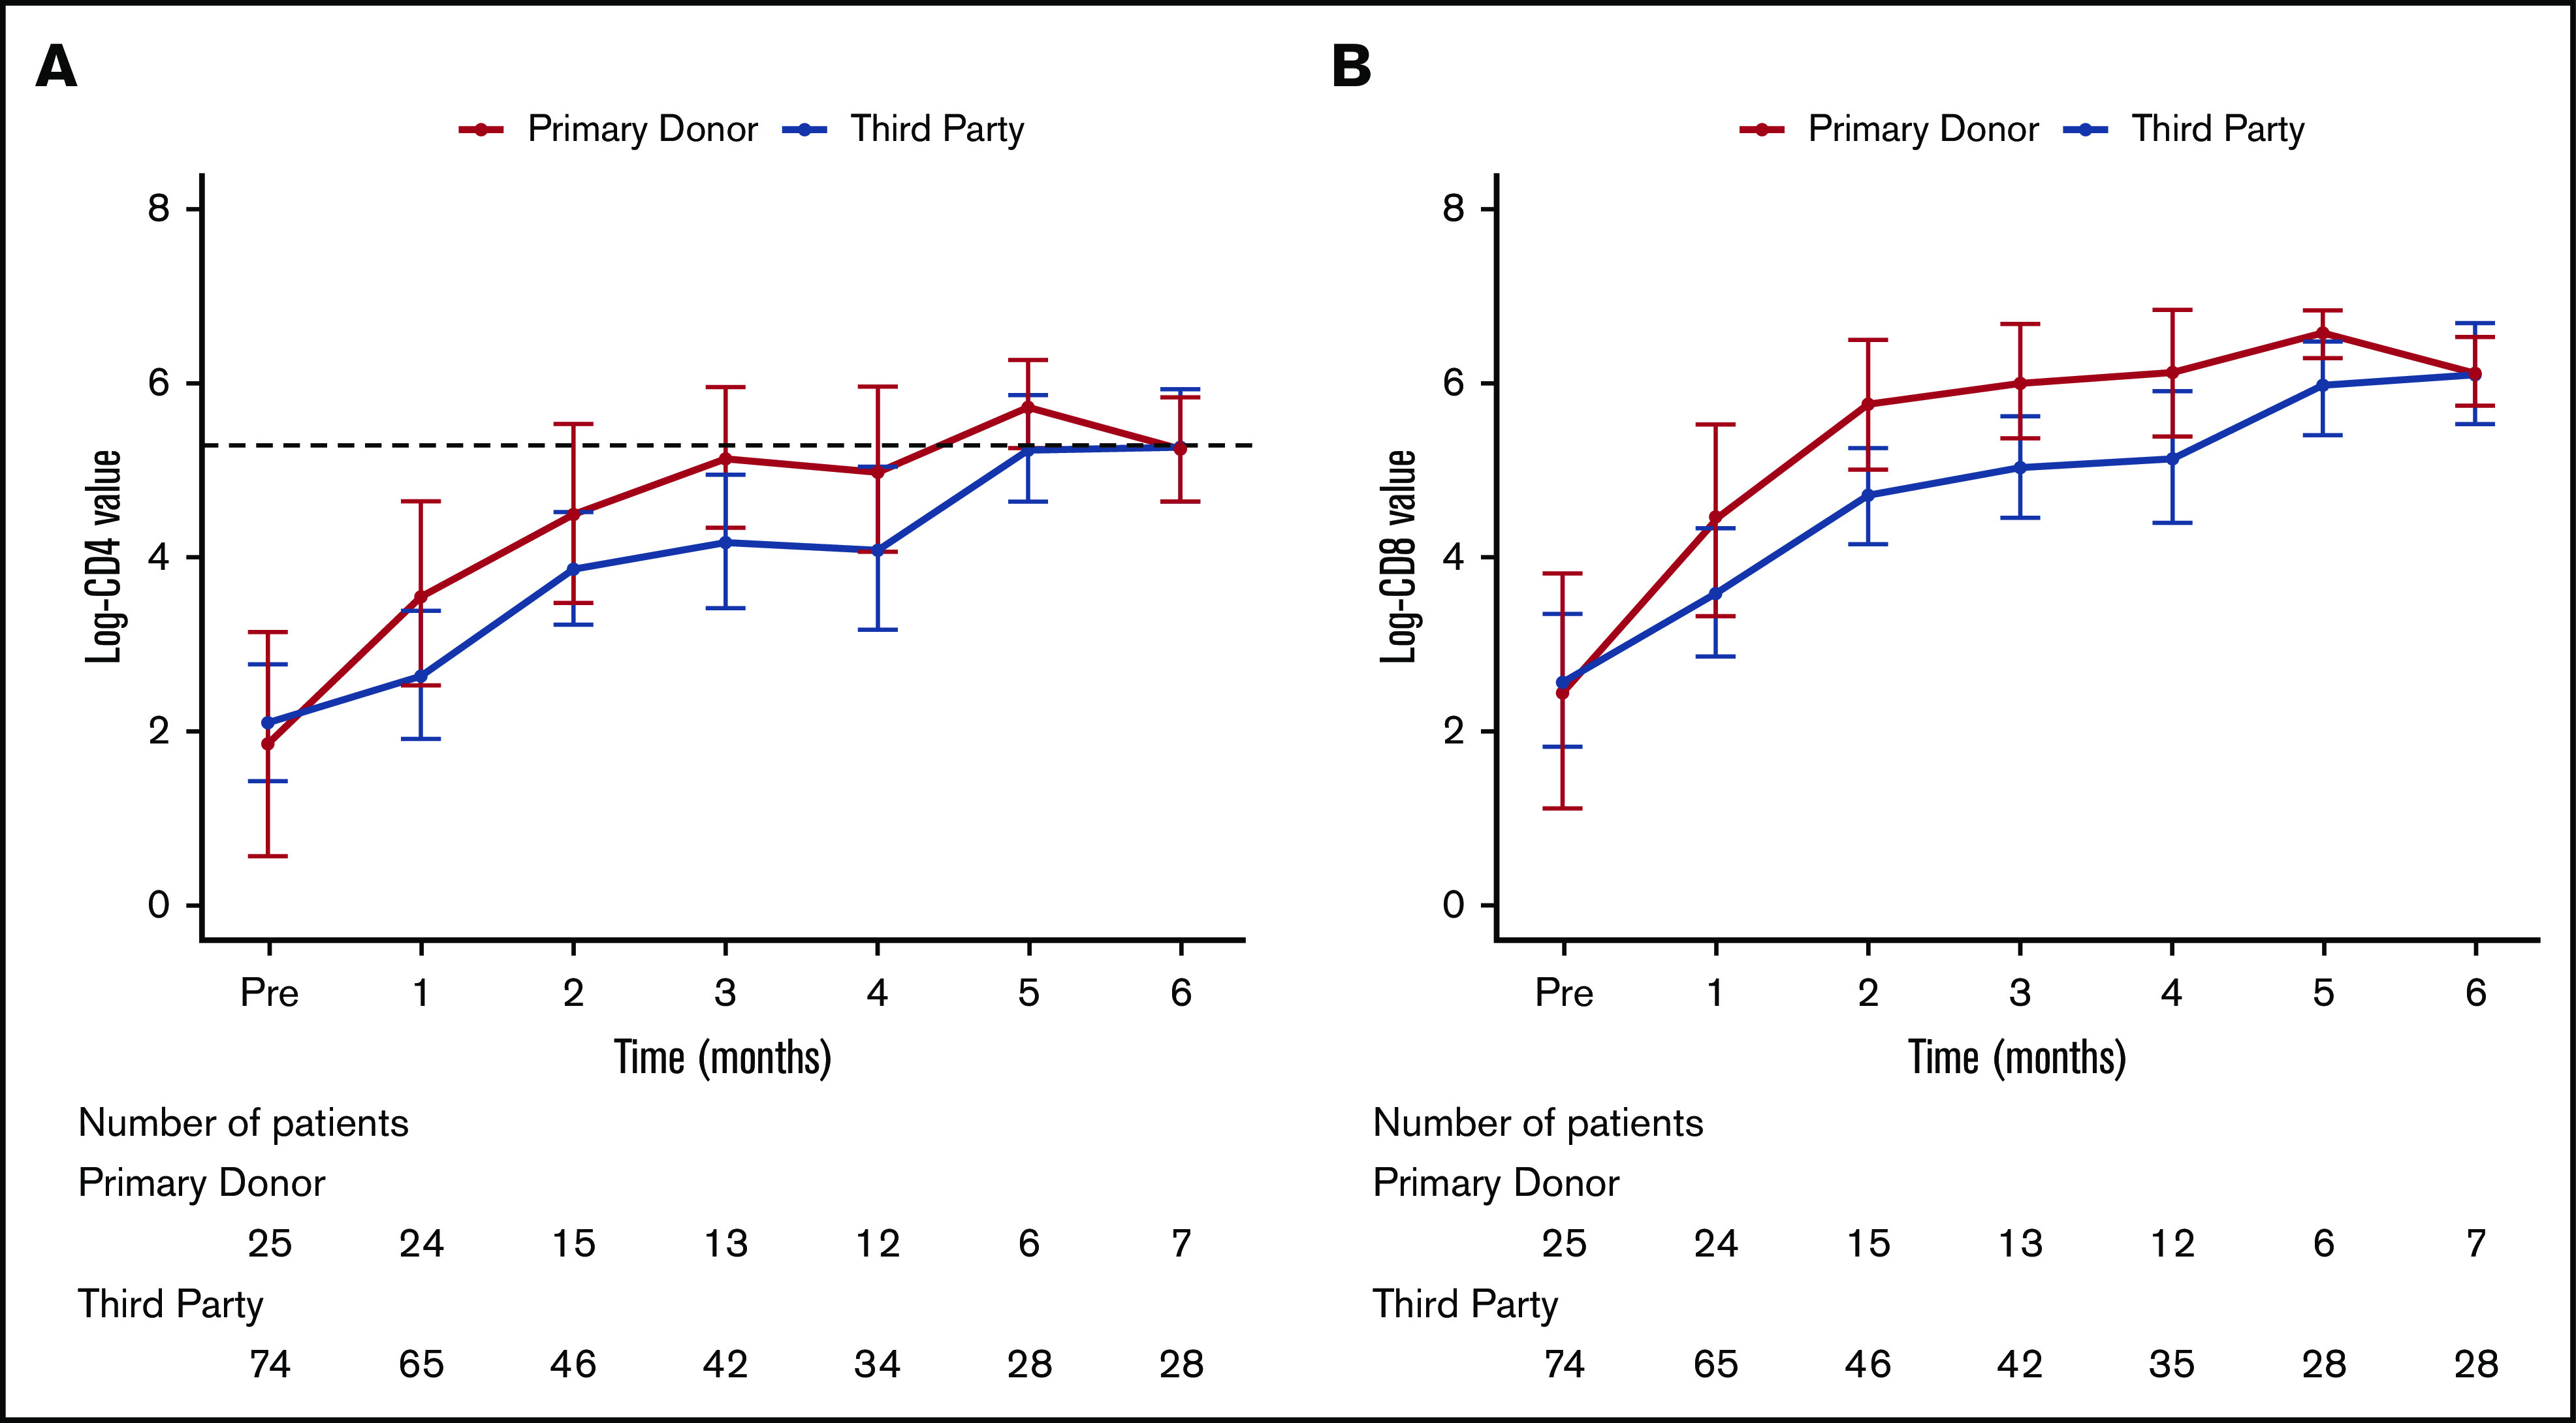
Figure 3.

The log of CD4+and CD8+over time does not differ between donor types. (A) Mean and 95% CI for log of CD4+ over time by donor type. The dashed line represents the CD4 = 200 × 106/L threshold (P = .28). (B) Mean and 95% CI for log of CD8+ over time by donor type (P = .13).
