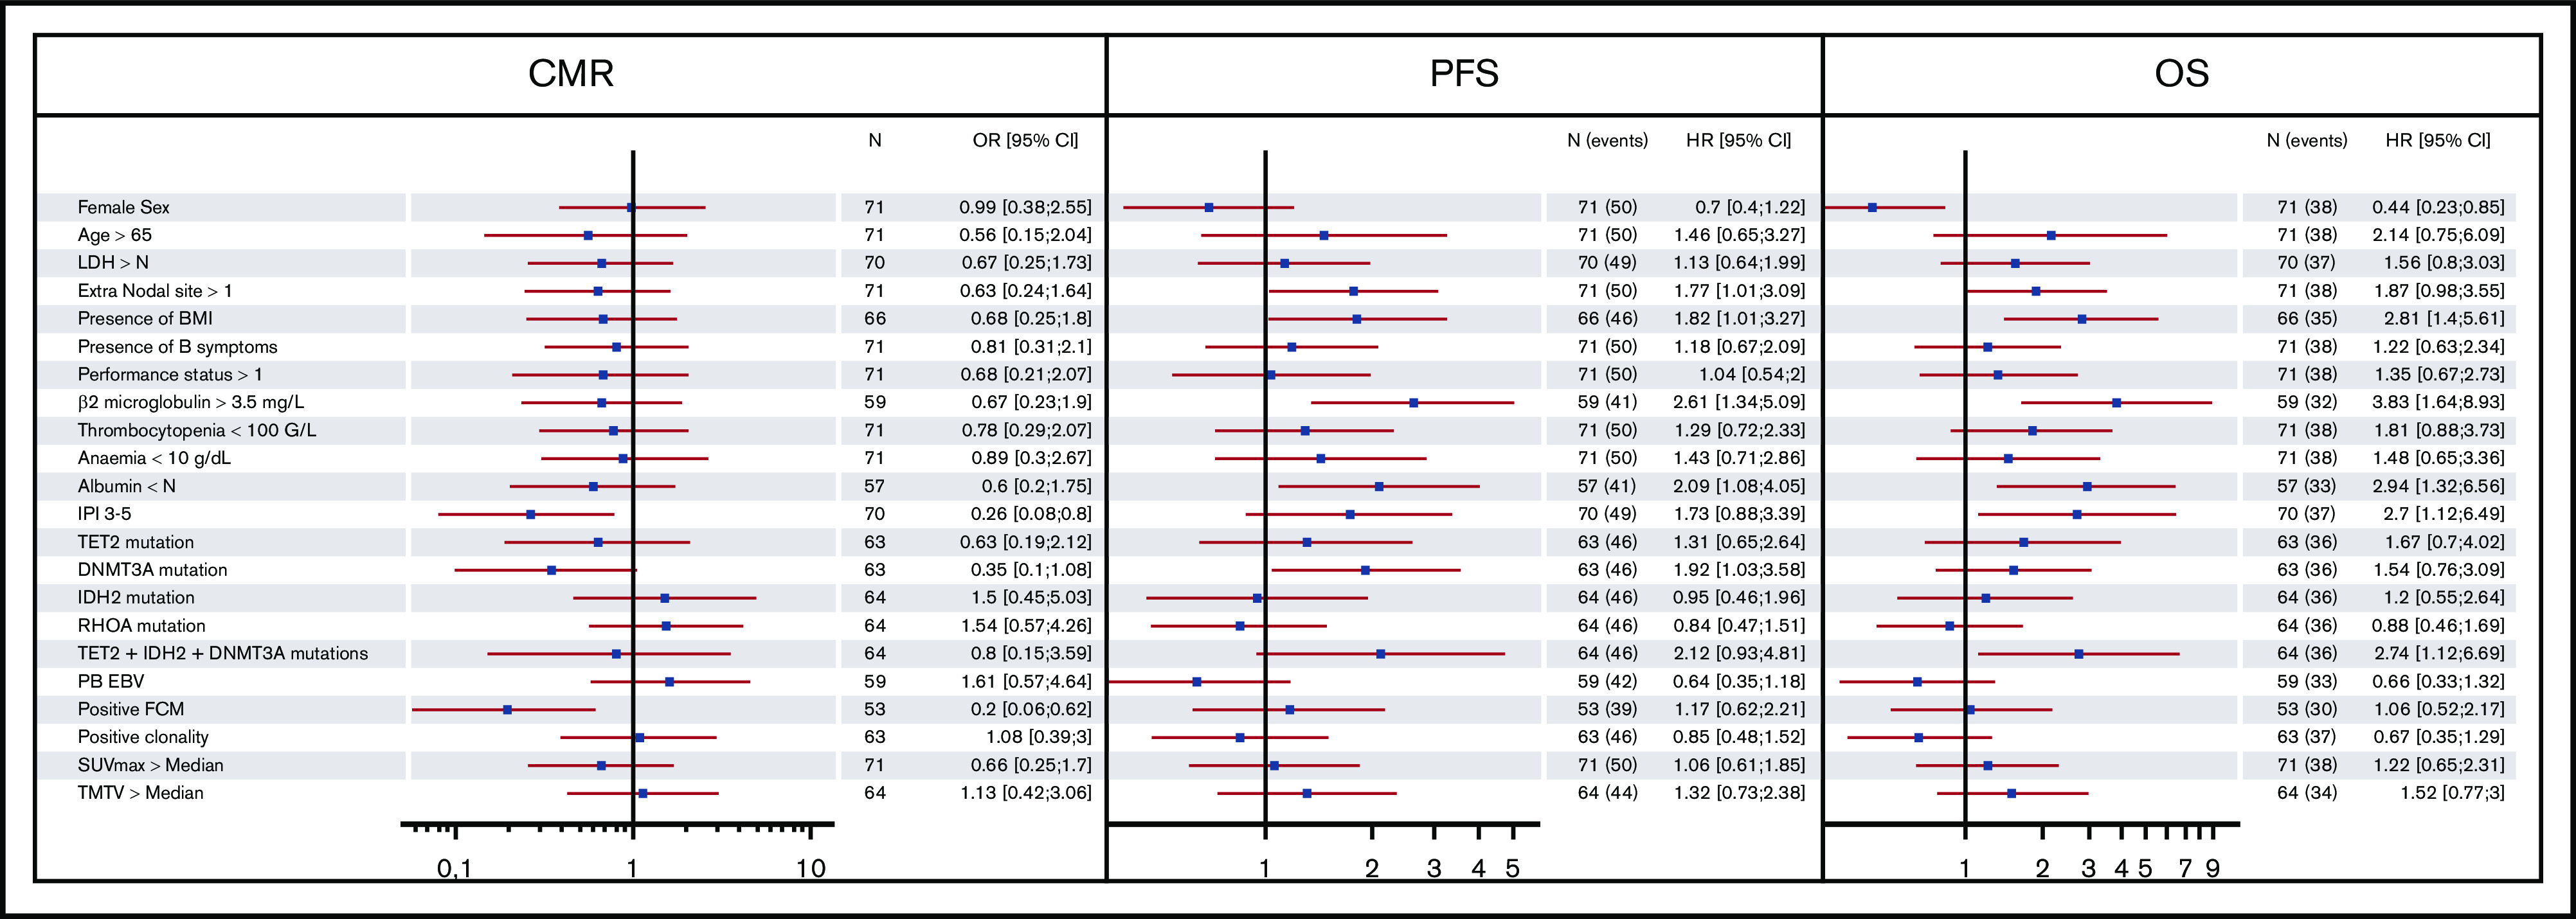
Figure 4.

Forest plot representing the impact of clinical, biologic, and molecular features on CMR, PFS, and OS. BMI, bone marrow involvement; TMTV, total metabolic tumor volume; FCM, flow cytometry; PB EBV, EBV viral load measured in peripheral blood > median.
