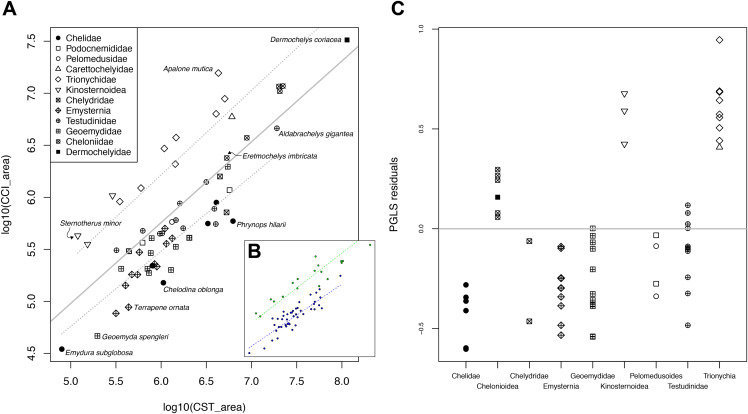
Figure 21. Relationship of internal carotid artery size and stapedial artery size in turtles.
(A) pGLS regression of log10-cross-sectional diameter of internal carotid artery canal on log10-cross-sectional diameter of stapedial artery canal. Solid grey line is the regression line describing a model with a single slope and intercept for all taxa. Dashed grey lines are regression lines for subsets of the data (see text and Table 3 for details). (B) Plot showing which data points were used as subsets for the multiple regression model test. Green points represent the subset containing kinosternoids, chelonioids, and trionychians, whereas blue points represent the subset containing the remaining turtle clades. (C) Residual plot of pGLS regression of the full dataset, ordered by clades. Symbols in A and C denote clade attributions.

