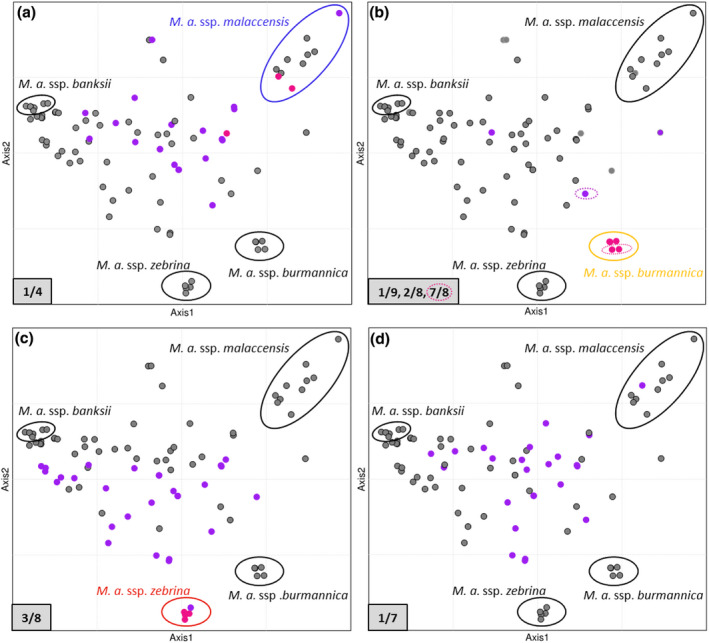
Figure 3.

Translocation distributions in diploid Musa acuminata germplasm. Factorial analysis was performed on 34 wild M. acuminata accessions with projection of 58 diploid cultivars and hybrids along the synthetic axes (the first two axes are represented). Accessions homozygous or heterozygous for a translocation are represented by pink and purple dots, respectively. (a) Translocation 1/4. (b) Translocations 1/9 and 2/8. Translocation 7/8 is indicated by hashed circles. (c) Translocation 3/8. (d) Translocation 1/7. Note that some dots are superposed; for more details, see Figure S3.
