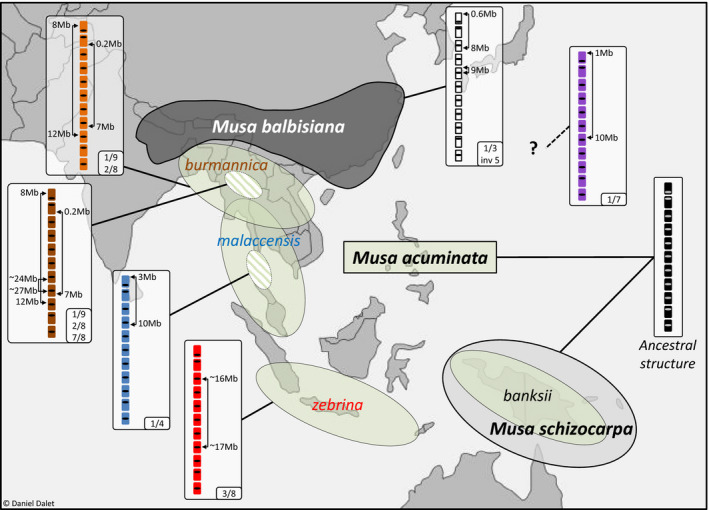
Figure 5.

Geographical distribution of the main Musa species and subspecies involved in cultivated bananas and the associated translocated chromosome structures. Areas indicate the geographical distribution of the main Musa species and subspecies according to Perrier et al. (2011). Boxes represent structural rearrangements found in these species and subspecies. Hatched circles indicate that translocations were identified in part of the subspecies but do not point to specific regions. The outline map was modified from http://www.histgeo.ac‐aix‐marseille.fr/ancien_site/carto.
