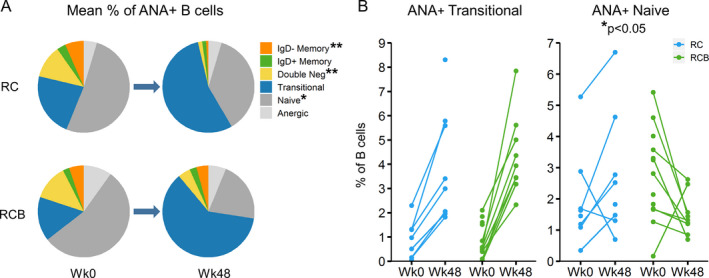
Figure 3.

Reconstitution of autoreactive antinuclear antibody–positive (ANA+) B cell subsets following treatment with RC versus RCB in the per protocol population at week 48. A, Mean frequencies of B cell subpopulations within total ANA+ B cells from each group before treatment and at week 48 (number of peripheral blood mononuclear cells [PBMCs] ranging 8–13). * = P < 0.05; ** = P < 0.01 between treatment groups at week 48. B, ANA+ transitional and ANA+ naive B cells as a percentage of total B cells in the peripheral blood before treatment and at week 48. Each data point represents the relative frequency of ANA+ transitional B cells (left) or ANA+ naive B cells (right) in an individual patient at each time point (number of PBMCs ranging 8–13). * = P < 0.05 between treatment groups, using Fisher’s exact test. For more details, see Supplementary Tables 4–6, available on the Arthritis & Rheumatology website at http://onlinelibrary.wiley.com/doi/10.1002/art.41466/abstract. Double neg = CD27−IgD− double‐negative (see Figure 1 for other definitions).
