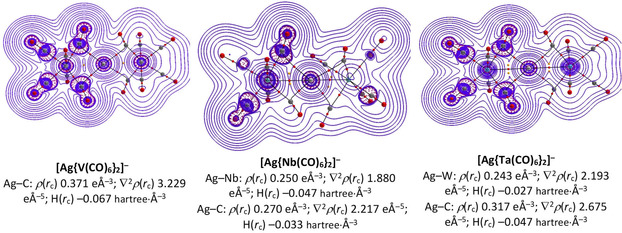
Figure 6.

The contour plot of the Laplacian of electron density, ∇2 ρ(r) in the Ag‐C‐M plane of [Ag{M(CO)6}2]− (M=V, Nb, Ta). The values of topological descriptors are provided in au. The blue solid lines indicate regions of charge depletion (∇2 ρ(r)>0) and red dotted lines indicate regions of charge accumulation (∇2 ρ(r)<0). Red and yellow spheres represent bond critical points and ring critical points, respectively.
