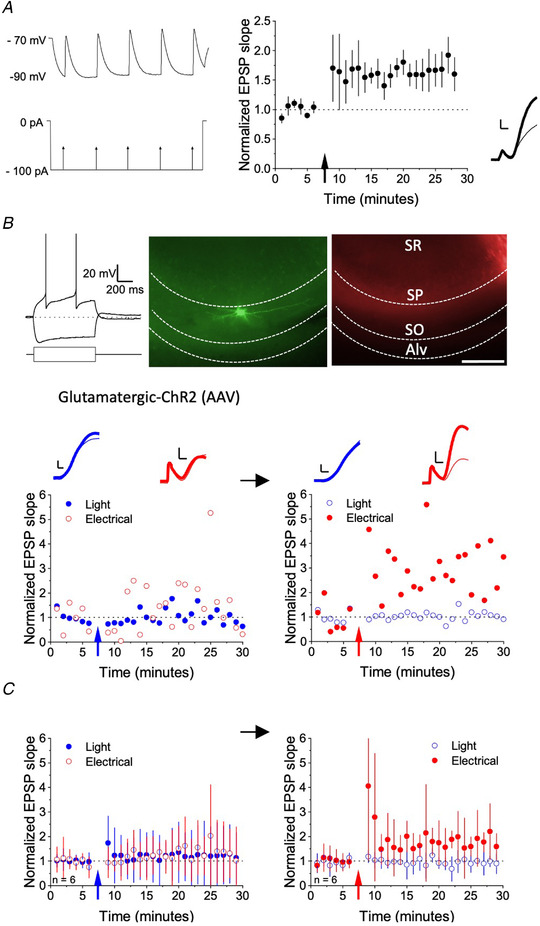
Figure 1. Pairing optogenetic stimulation of glutamatergic afferents with hyperpolarization fails to evoke LTP in stratum oriens interneurons.

A, left: pairing protocol. Electrical stimulation at 5 Hz (lower trace schematic) when holding the postsynaptic cell close to −90 mV (upper sample trace from one cell). Right: EPSP initial slope normalized to baseline and averaged across six cells (± SD). Inset: initial phase of EPSP in a representative example before (thin trace) and 20 min after (thick trace) pairing. Scale bars = 1 mV, 2 ms. B, pairing optogenetic stimulation of glutamatergic axons with hyperpolarization in an example stratum oriens interneuron. Top, left: voltage response to 100 pA positive and negative current injection. Top, middle and right: biocytin staining of the interneuron revealed with streptavidin Alexa‐488 (green), and mCherry ChR2 tag (red). The borders of the alveus (Alv), stratum oriens (SO), stratum pyramidale (SP) and stratum radiatum (SR) are indicated. Scale bar = 50 μm. Below: timecourse of EPSPs evoked by light (blue) or electrical stimulation (red). Left: the 5 Hz pairing protocol delivered to the light pathway, indicated by the blue arrow, failed to induce LTP (filled points). In the same cell, after renormalizing the baseline, the same pairing protocol delivered to the electrical pathway induced LTP (right). Traces show the averages of five trials before (thin lines) and after pairing (thick lines). Scale bars = 1 mV, 2 ms. C, summary plot from six cells (mean ± SD) where optogenetic (left) and electrical stimulation (right) were sequentially paired with hyperpolarization. [Color figure can be viewed at wileyonlinelibrary.com]
