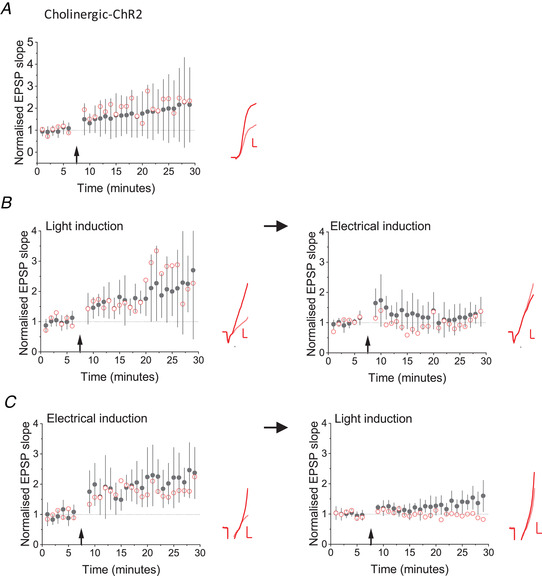
Figure 2. Optogenetic stimulation of cholinergic axons potentiates glutamatergic EPSPs.

A, LTP induced by pairing 5 Hz light pulses with hyperpolarization of stratum oriens interneurons in Chat‐Cre x Ai32 mice (pairing protocol indicated by arrow) in 36 cells. Black filled symbols and error bars: mean ± SD. Red open symbols: data from one cell. Inset: average EPSPs before (pink) and 25−30 min after (red) pairing. B, optogenetic cholinergic stimulation in Chat‐Cre x Ai32 mice (left) induced a potentiation (n = 9, P = 0.002, paired t test), which was followed by a smaller potentiation induced by subsequent tetanic electrical stimulation (right). Black and red symbols and traces as for (A). C, tetanic electrical stimulation in Chat‐Cre x Ai32 mice (left) led to LTP of EPSPs in oriens interneurons (n = 6, P = 0.009, paired t test), which was followed by a smaller effect of subsequent optogenetic cholinergic stimulation (right). Black and red symbols and traces as for (A). Scale bars = 2 mV, 2 ms. [Color figure can be viewed at wileyonlinelibrary.com]
