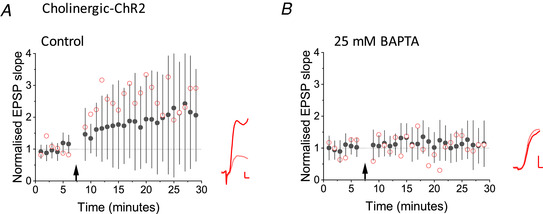
Figure 3. BAPTA attenuated LTP elicited by optogenetic stimulation of cholinergic axons.

A, LTP induced by optogenetic stimulation of cholinergic fibres in interleaved control experiments. Black filled symbols and error bars: mean ± SD. Red open symbols: data from one cell. Inset: average EPSPs before (pink) and 25−35 min after (red) pairing. B, inclusion of 25 mm BAPTA in the pipette solution profoundly attenuated LTP (P = 0.047, unpaired t test comparing potentiation elicited in both conditions). Black and red symbols and traces as for (A). Scale bars = 1 mV, 2 s. [Color figure can be viewed at wileyonlinelibrary.com]
