
Figure 1.
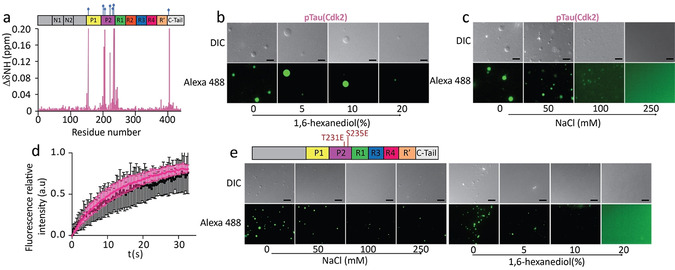
LLPS of tau phosphorylated at disease‐associated epitopes. a) 1H‐15N chemical shift perturbation of hTau40 upon Cdk2 phosphorylation identifying sites of phosphorylation. b,c) pTau(Cdk2) (25 μm) forms liquid‐like droplets that dissolve upon addition of 1,6‐hexanediol (b) or with increasing ionic strength (c). Scale bars, 10 μm. d) FRAP of 50 μm pTau(Cdk2) (pink) and hTau40 (black). FRAP curves are averaged from four individual measurements; error bars represent standard deviation. e) /S235E‐mutant hTau23 (50 μm) forms liquid‐like droplets that dissolve with increasing ionic strength (left), or the addition of 1,6‐hexanediol (right). Scale bars, 10 μm. Top panel, domain organization of hTau23 mutated at T231E and S235E.