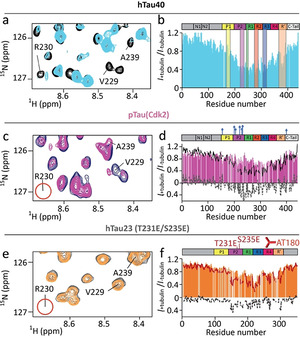
Figure 3.

AT180‐phosphorylation perturbs the interaction of tau's P2 region with tubulin. a,c,e) Superposition of a selected region of the 1H‐15N HSQC of hTau40 (a), pTau(Cdk2) (c) and hTau23 (T231E/S235E) (e) in its free state (a: black; c: blue; e: grey) and in presence of tubulin (1:0.5 tau:tubulin molar ratio; a: light blue; c: pink; e: orange). Upon phosphorylation by Cdk2 or T231E/S235E mutation the cross peak of R230 disappears (marked by red circle). b,d,f) Signal attenuation of 1H‐15N signals of hTau40 (b), pTau(Cdk2) (d) and hTau23 (T231E/S235E) (f) (each 10 μm) upon addition of 5 μm unpolymerized tubulin. Previously identified hot spots of the tau/tubulin interaction [14a] are marked in (b). The profiles of hTau40 (black) and hTau23 (red) are shown for comparison. Residue‐specific difference are shown as dashed line.
