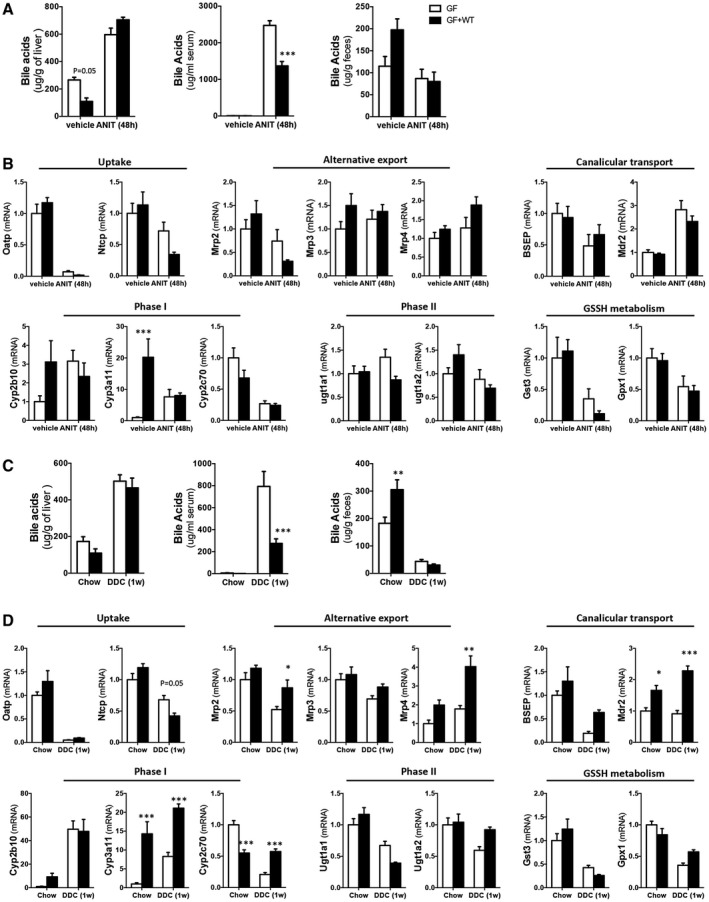
Fig. 3.

ANIT and 0.1% DDC promote similar cholestasis in GF and GF + WT mice while showing differences in bile acid metabolism. (A) Quantification of bile acid pool size in livers, serum, and fecal samples from WT and GF + WT mice by MS‐HPLC at 48 hours after ANIT. (B) Gene expression determined by qPCR of xenobiotic and bile acids transporters, phase I and II detoxification, as well as glutathione metabolism in liver samples from GF and GF + WT mice after ANIT. (C) Quantification of bile acid pool size in livers, serum, and fecal samples from WT and GF + WT mice by MS‐HPLC after feeding with 0.1% DDC for 1 week. (D) qPCR of xenobiotic and bile acids metabolism in liver samples from GF and GF + WT mice after 0.1% DDC. Graphs show results from n ≥ 5 animals per treatment group. Values are mean ± SEM. *P < 0.05; **P < 0.01; ***P < 0.001 (GF vs. GF + WT). Abbreviations: GSSH, oxidized glutathione; Mrp3, multidrug resistance‐associated protein 3.
