Fig. 6.

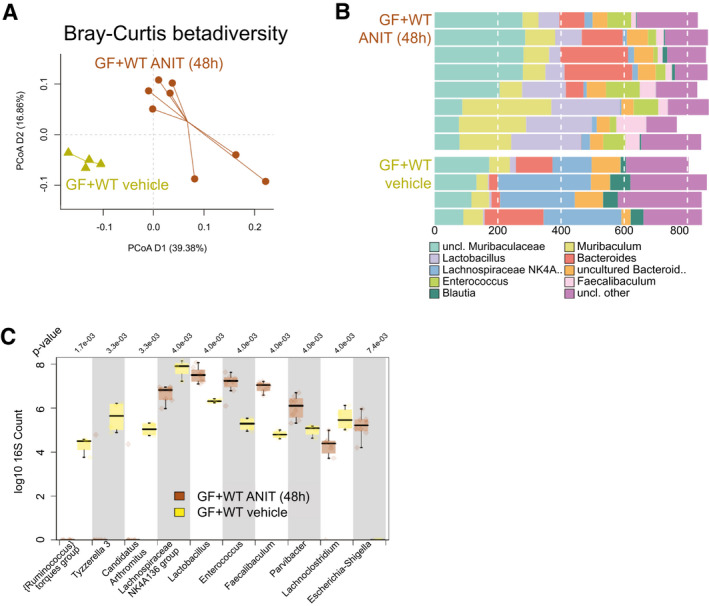
Intestinal microbiome composition changes during ANIT‐induced cholestasis. (A) Genus level PCoA (Bray‐Curtis distance) after 16s rRNA sequencing of intestinal microbiome composition. (B) Composition plot of the 10 most abundant taxonomic groups at genus level. Note that because of the often‐incomplete taxonomy, in some cases either the next known taxonomic level was chosen to represent the OTUs, whereas “Lachnospiraceae NK4A 136 group” does refer to a taxonomic group within family Lachnospiraceae. (C) Box plot of genera most significantly different between vehicle/GF + WT (n = 4) and ANIT/GF + WT (n = 8) mice. P value is shown above the plot; after multiple testing, all shown taxa were significantly different. *P < 0.05; **P < 0.01; ***P < 0.001 (vehicle/GF+WT vs. ANIT/GF + WT). Abbreviations: OTUs, operational taxonomic units; PCoA, principal coordinates analysis; uncl., unclassified.
