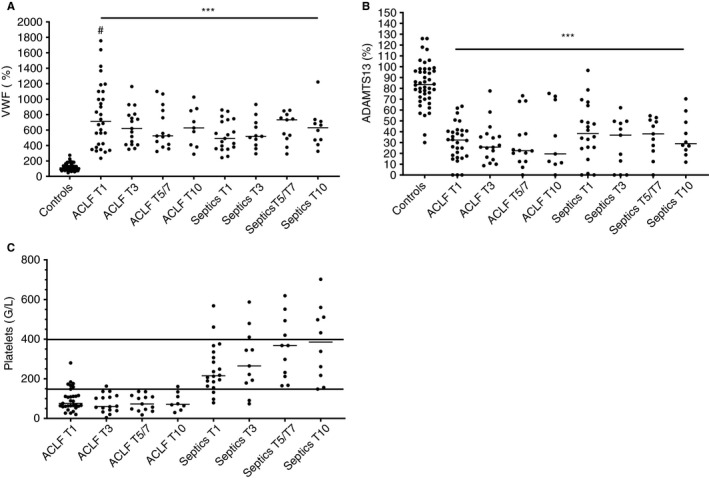
FIGURE 1.

Plasma levels of von Willebrand factor (A), ADAMTS13 (B), and platelet count (C) in patients with ACLF and non‐liver septics sampled at various time points after admission in comparison to healthy controls. Horizontal lines indicate medians. *** = P < .001 versus controls, # = P < .05 versus sepsis
