FIGURE 2.

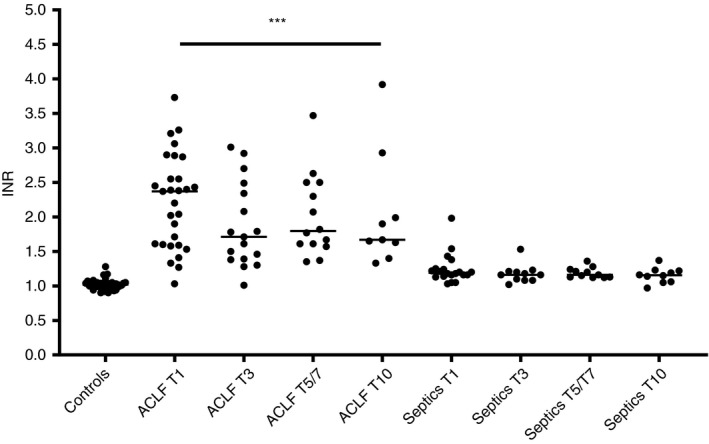
INR values in patients with ACLF and non‐liver septics sampled at various time points after admission in comparison to healthy controls. Horizontal lines indicate medians. *** = P < .001 vs controls

INR values in patients with ACLF and non‐liver septics sampled at various time points after admission in comparison to healthy controls. Horizontal lines indicate medians. *** = P < .001 vs controls