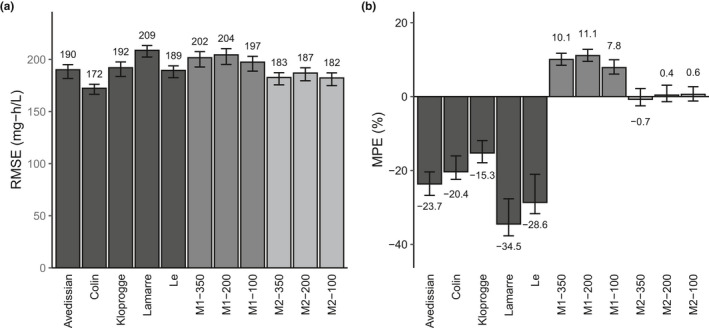
Figure 3.

Estimation of area under the curve (AUC) for simulated concentration‐time curves. (a) Root mean squared error (RMSE) and (b) mean percent error (MPE) for AUC estimates for the literature models, one‐compartment (M1) and two‐compartment (M2) continuous learning models for data simulated using the Kloprogge model. Bars indicate the average value of bootstrapped samples and error bars indicate the 2.5th and 97.5th percentile of bootstrapped samples. AUC calculation error is expressed relative to the simulated “true” AUC.
