
Figure 7.
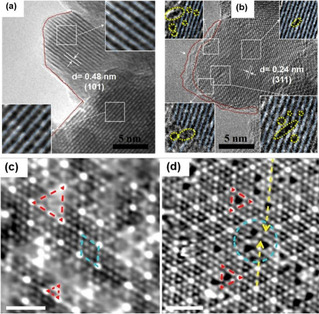
(a, b) HRTEM image of CMO and CMO‐4. The insets of (a) and (b) show magnified view of perfect and distorted lattices in (a) CMO and (b) CMO‐4, respectively. The red dotted lines indicate smooth and rough edges of particles in CMO and CMO‐4. The blue lines [insets of (a) and (b)] highlight crystallographic planes, while the yellow dotted circles/eclipses indicate intra/inter‐crystalline sites and surface oxygen vacancies. Reproduced from Ref. [66] with permission from Elsevier, Copyright 2017. (c) STM image for the formation of oxygen vacancies in CeO2(111)/Pt (111) of the imperfect 3 : 4 lattice match in monolayered CeO2(111)/Pt (111), V=−0.27 V, I=0.20 nA, scale bar=2 nm. Mismatched and 3 : 4 matched domains are marked by red‐dashed triangles and blue‐dashed rhombus, respectively. (d) STM image of the O vacancies (red dashed triangles) formed in the mismatched areas (blue dashed circles), V=−0.11 V, I=1.2 nA, scale bar=2 nm. Reproduced from Ref. [67] with permission from American Chemical Society, Copyright 2020.