
Figure 10.
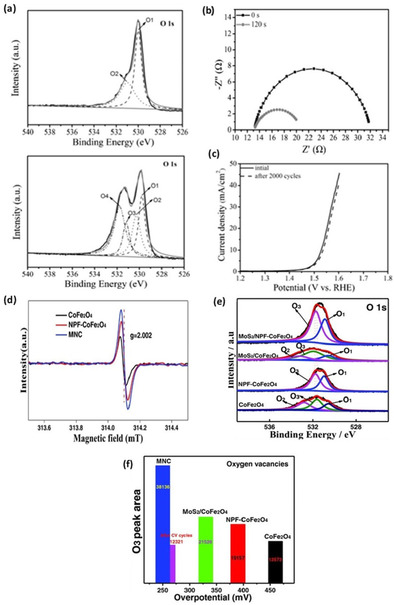
(a) Fitted O 1s XPS spectra, (b) OER Nyquist plot, and (c) LSV stability polarization curve of OER on pristine and plasma‐engraved reduced Co3O4. Reproduced from Ref. [86] with permission from WILEY‐VCH Verlag GmbH & Co. KGaA, Weinheim, Copyright 2016. (d) EPR spectra with a g factor of 2.002, (e) fitted O 1s XPS spectra, and comparison between oxygen vacancy (O3) XPS peak area, (f) OER overpotentials [mV] of spinel CoFe2O4, N, P, and F tri‐doped (NPF), CoFe2O4 (NPF−CoFe2O4), and MoS2/NPF−CoFe2O4 (MNC). Reproduced from Ref. [88] with permission from WILEY‐VCH Verlag GmbH & Co. KGaA, Weinheim, Copyright 2018.