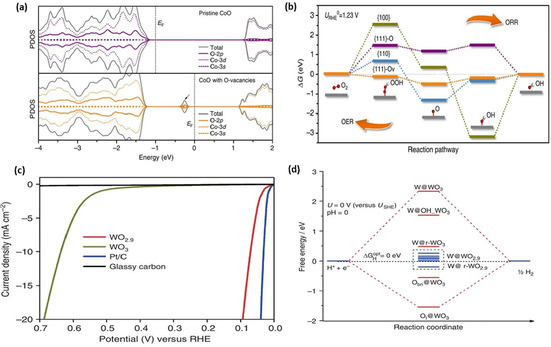
Figure 14.

(a) PDOS of pristine CoO and oxygen‐vacant CoO (black arrow points towards newly created electronic states near the Fermi level in CoO with oxygen vacancies, responsible for adsorption of intermediates on the oxygen vacancies sites) and (b) calculated ORR/OER free‐energy coordinate energy diagram at the equilibrium potential (1.23 V vs. RHE) on different CoO facets. Reproduced from Ref. [85] with permission from Springer Nature, Copyright 2016. (c) LSV polarization curves for oxygen vacant WO2.9, WO3, and benchmark Pt/C for the HER and (d) calculated free‐energy diagram of HER at the equilibrium potential for a series of active sites on (001) WO3 and (010) WO2.9. Reproduced from Ref. [105] with permission from Springer Nature, Copyright 2015.
