
FIGURE 2.
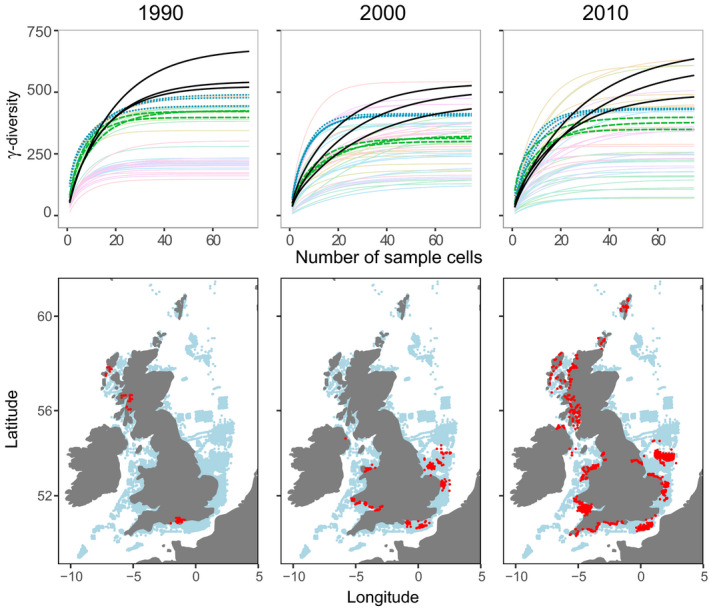
Top panels: rarefaction of marine benthic assemblages used to estimate γ‐diversity for years 1990, 2000 and 2010. Crossing curves demonstrate that the sites rank‐order based on richness is not conserved as the number of sample cells (i.e. spatial units) increases, and this feature is consistent over time (n = 50 cells were randomly selected in 2000 and 2010 where there were data for >50). We highlight areas which may have relatively low to intermediate species richness based on a low number of sample cells (black lines) compared with other areas (e.g. blue dotted and green dashed lines) but, because of higher dissimilarity between local assemblages, tend to have some of the highest species richness values at larger scales. Based on these results, we would draw contrasting conclusions about which area was most diverse depending on whether we looked at 1, 20 and 60 sites within a region. Bottom panels: maps show differences in spatial data distribution between respective years (red = data collected in that year, blue = all data)