
FIGURE 5.
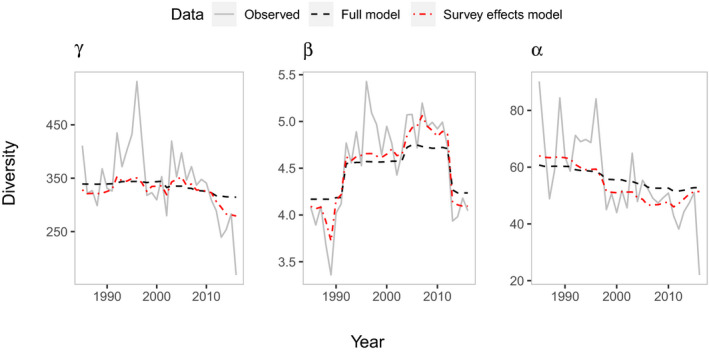
Observed versus partial dependence plots for full model and survey effects model estimates of temporal diversity. Change was partly captured by our environmental and survey covariates, revealed by the more limited change related to ‘Year’ in the full models, followed by the survey effects models, with most variation in our observed values