
FIGURE 6.
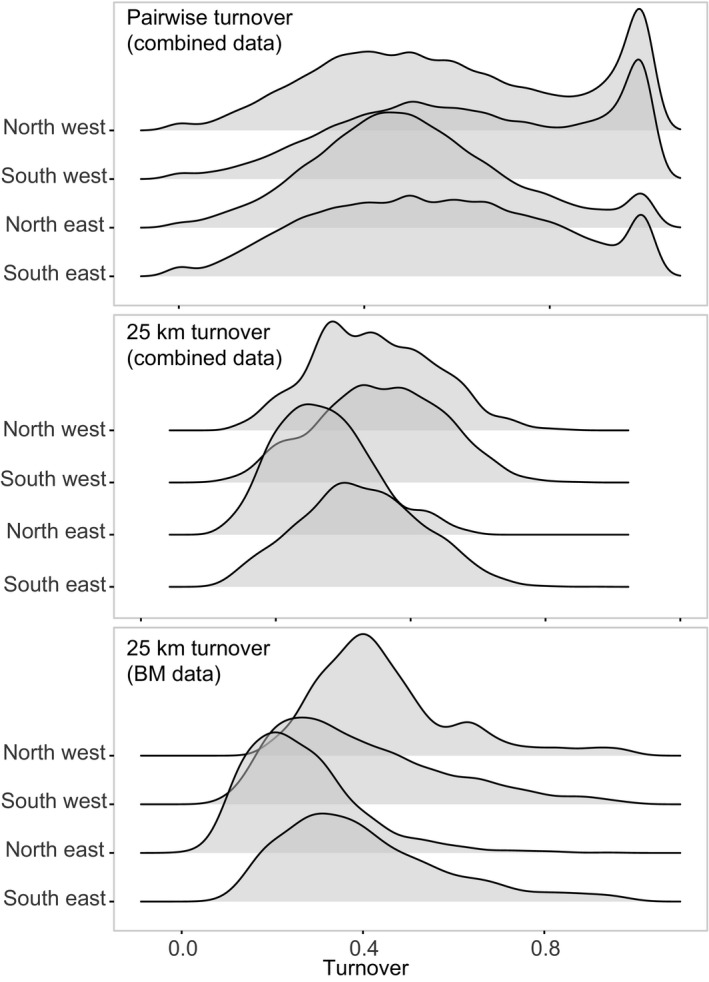
Density plots showing the distribution of pairwise and 25 km turnover estimates (i.e. β‐diversity) between cells sampled within the same year using the combined and BM datasets, respectively. Values were mostly intermediate, rather than bimodally distributed between extremes, indicating that many species were shared between unique multi‐species observations and thus individualistic processes were more prominent in general. Data have been split across UK regions (Figure S1) to show that this pattern was largely conserved through space