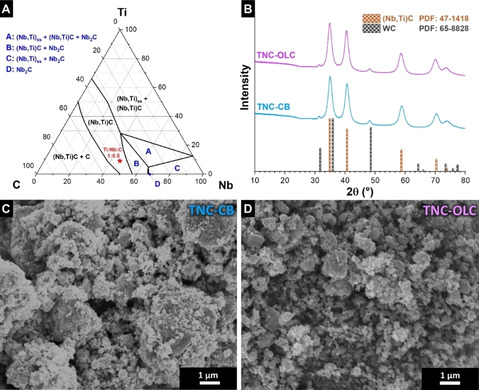
Figure 1.

(A) Ternary phase diagram of Ti‐Nb‐C at 1600 °C (adapted from Ref. [17]). The red star marks the chemical composition used for the carbide synthesis in this work. “ss” stands for a solid solution. (B) XRD pattern of the titanium niobium carbide samples and the matched Bragg positions. SEM images of (C) TNC‐CB and (D) TNC‐OLC obtained after ball‐milling.
