Figure 3.

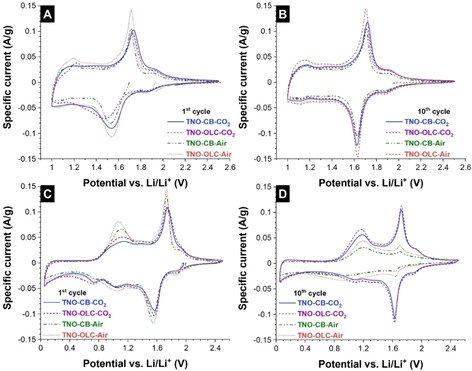
CVs at a scan rate of 0.05 mV s−1 of the first cycle (A, C) and the 10th cycle (B, D) of the samples for the potential window of 1.0–2.5 V vs. Li/Li+ (A, B) and 0.05–2.5 V vs. Li/Li+ (C, D).

CVs at a scan rate of 0.05 mV s−1 of the first cycle (A, C) and the 10th cycle (B, D) of the samples for the potential window of 1.0–2.5 V vs. Li/Li+ (A, B) and 0.05–2.5 V vs. Li/Li+ (C, D).